Free Access
Fig. 10.
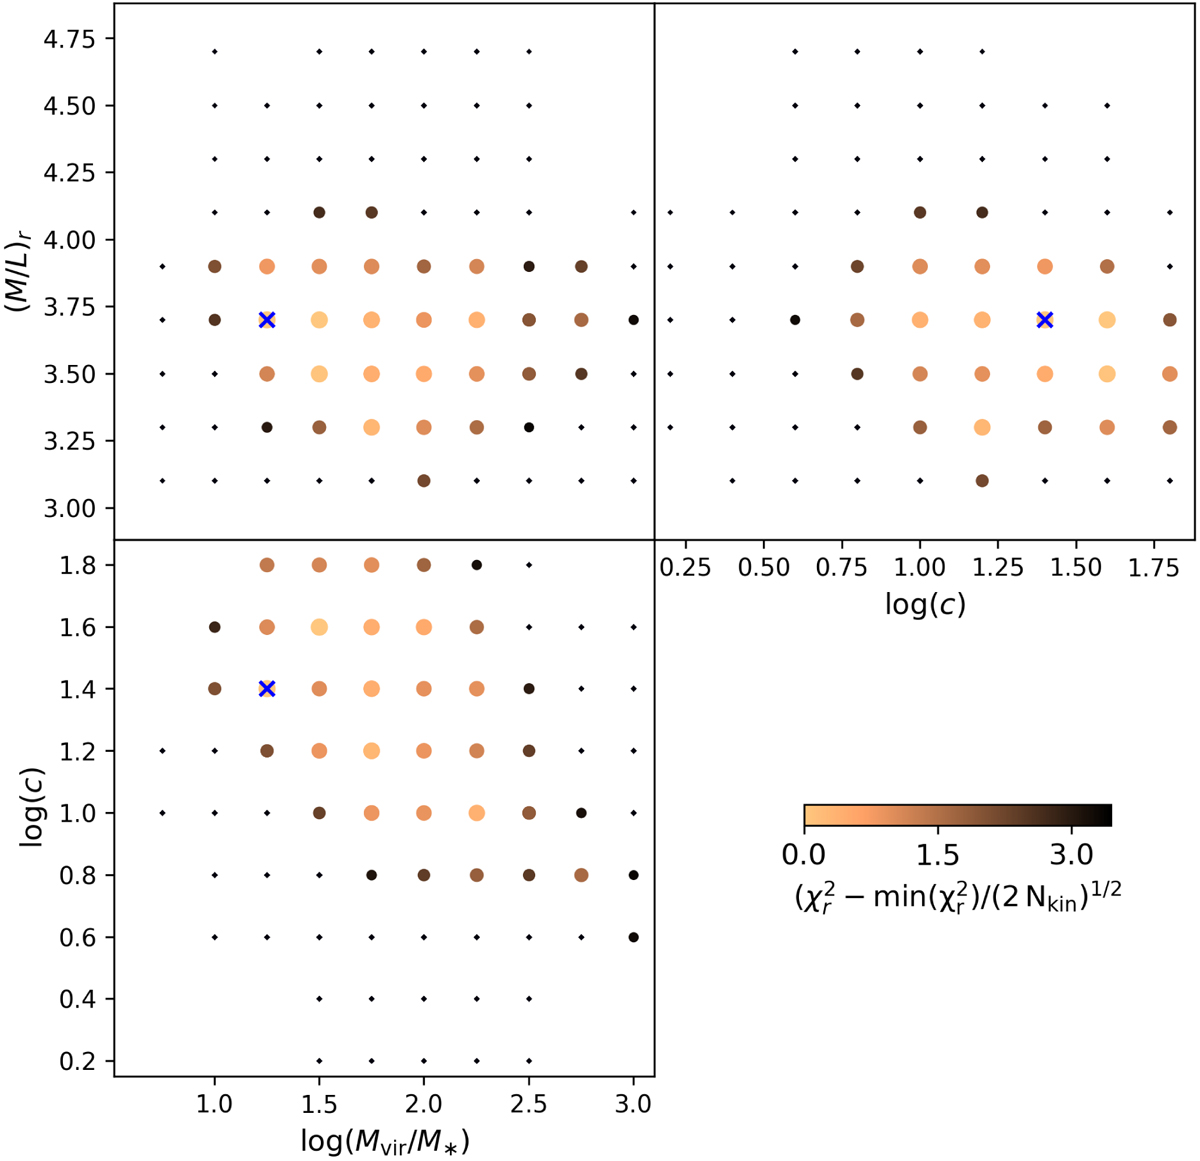
Illustration of the parameter grid explored by our model. Each dot represents one model. The colour code and the symbol size give the reduced ![]() , normalised such that the best fitting model as given by the blue cross reaches zero.
, normalised such that the best fitting model as given by the blue cross reaches zero.
Current usage metrics show cumulative count of Article Views (full-text article views including HTML views, PDF and ePub downloads, according to the available data) and Abstracts Views on Vision4Press platform.
Data correspond to usage on the plateform after 2015. The current usage metrics is available 48-96 hours after online publication and is updated daily on week days.
Initial download of the metrics may take a while.