Fig. 13.
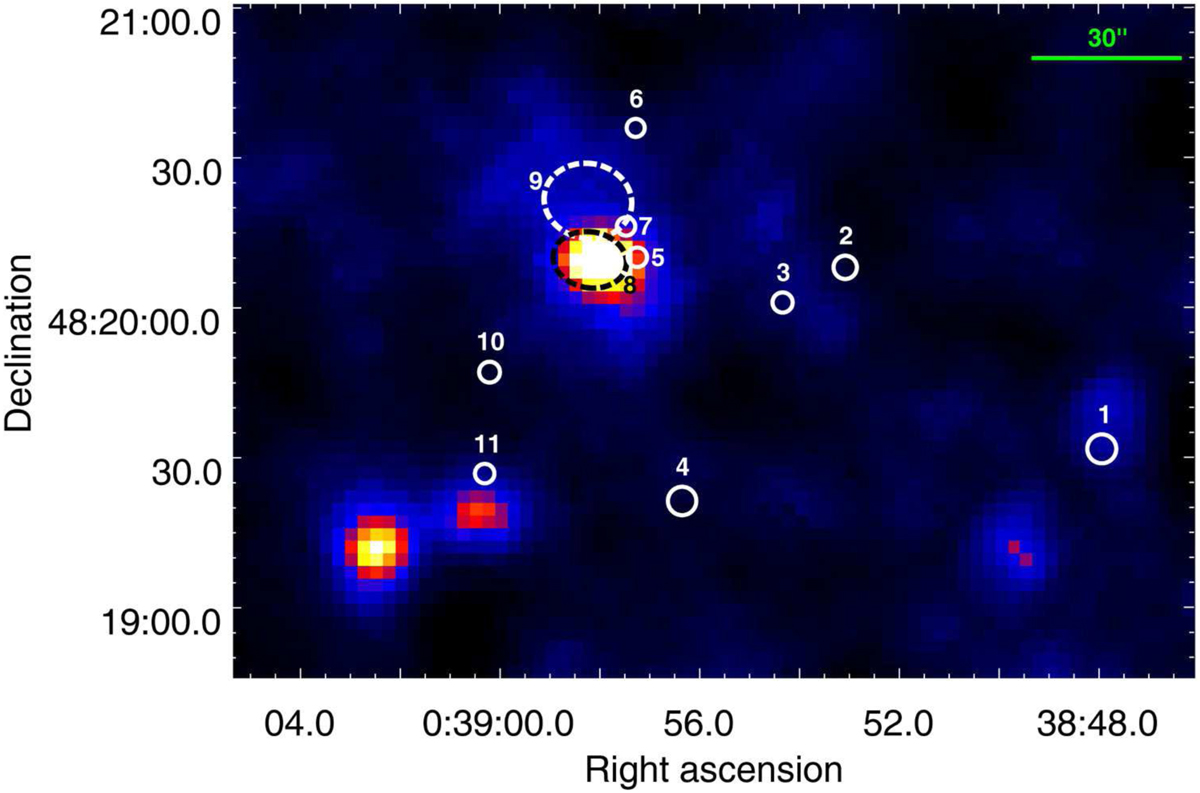
Adaptively smoothed, exposure-corrected combined EPIC image of the central parts of NGC 185. The image depicts emission detected over the 0.4 keV to 7.0 keV energy range (scaled with zscale/sinh and 100 smoothing counts). The optically detected sources are represented with filled circles, except objects VIEM 8 and 9 which are indicated with dashed circles.
Current usage metrics show cumulative count of Article Views (full-text article views including HTML views, PDF and ePub downloads, according to the available data) and Abstracts Views on Vision4Press platform.
Data correspond to usage on the plateform after 2015. The current usage metrics is available 48-96 hours after online publication and is updated daily on week days.
Initial download of the metrics may take a while.