Fig. 12.
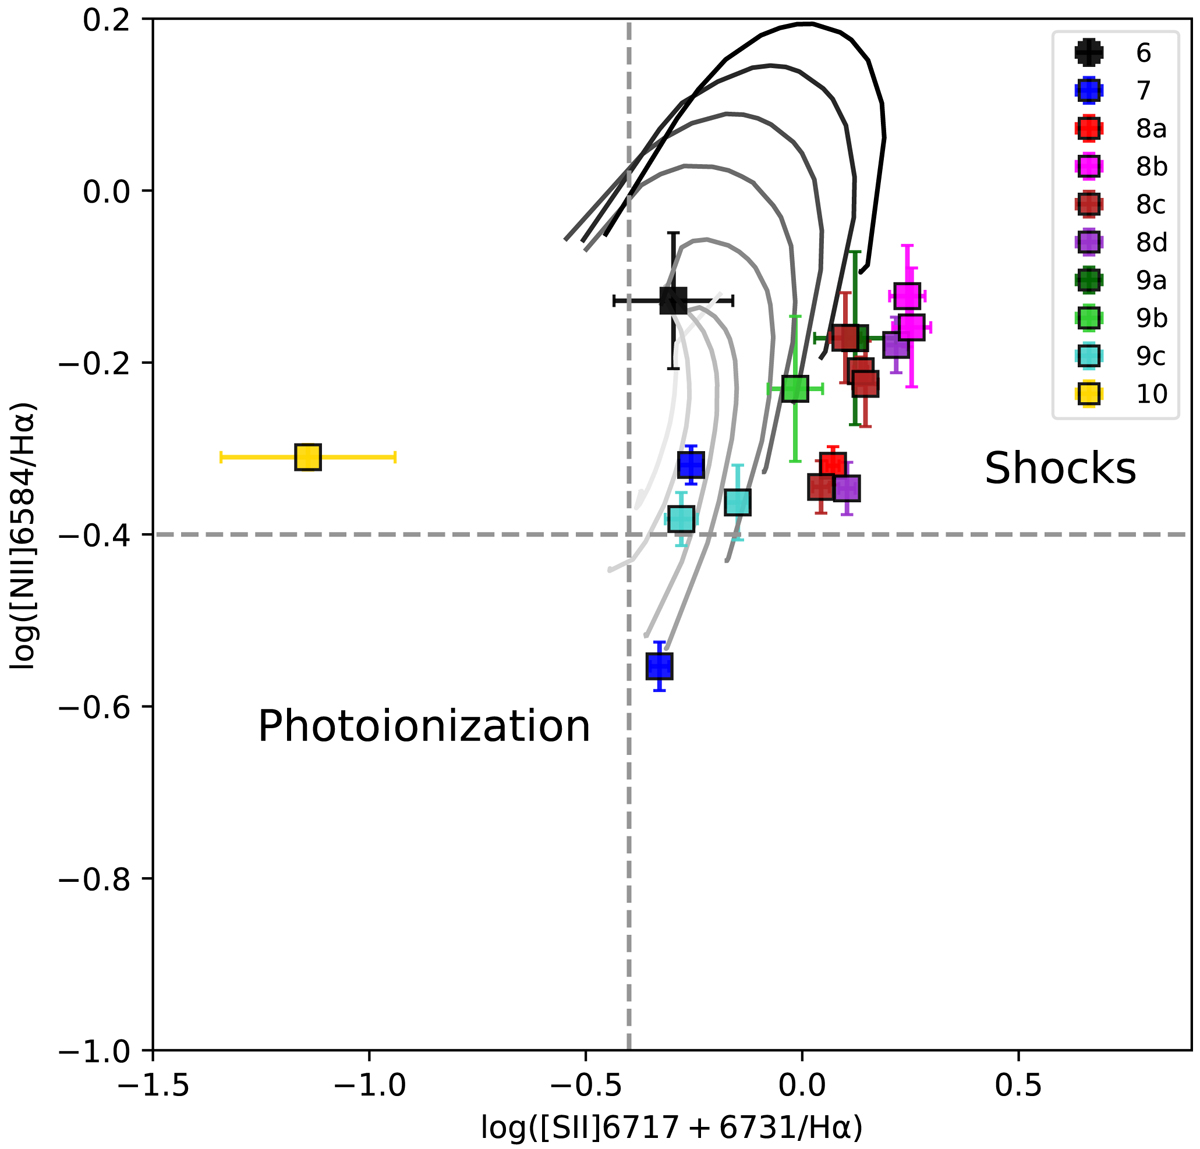
Hα/[N II] versus Hα/[S II] diagnostic diagram. Based on the discussion in Stasińska et al. (2006), simple separation lines are plotted to indicate regions with different ionization mechanisms: the bottom left quadrant is occupied by photoinized objects, while the upper right quadrant is occupied by shock-heated objects. MAPPINGS III (Allen et al. 2008) radiative shock models for solar abundances and preshock electron density ne = 10 cm−3 are overlaid.
Current usage metrics show cumulative count of Article Views (full-text article views including HTML views, PDF and ePub downloads, according to the available data) and Abstracts Views on Vision4Press platform.
Data correspond to usage on the plateform after 2015. The current usage metrics is available 48-96 hours after online publication and is updated daily on week days.
Initial download of the metrics may take a while.