Fig. 11.
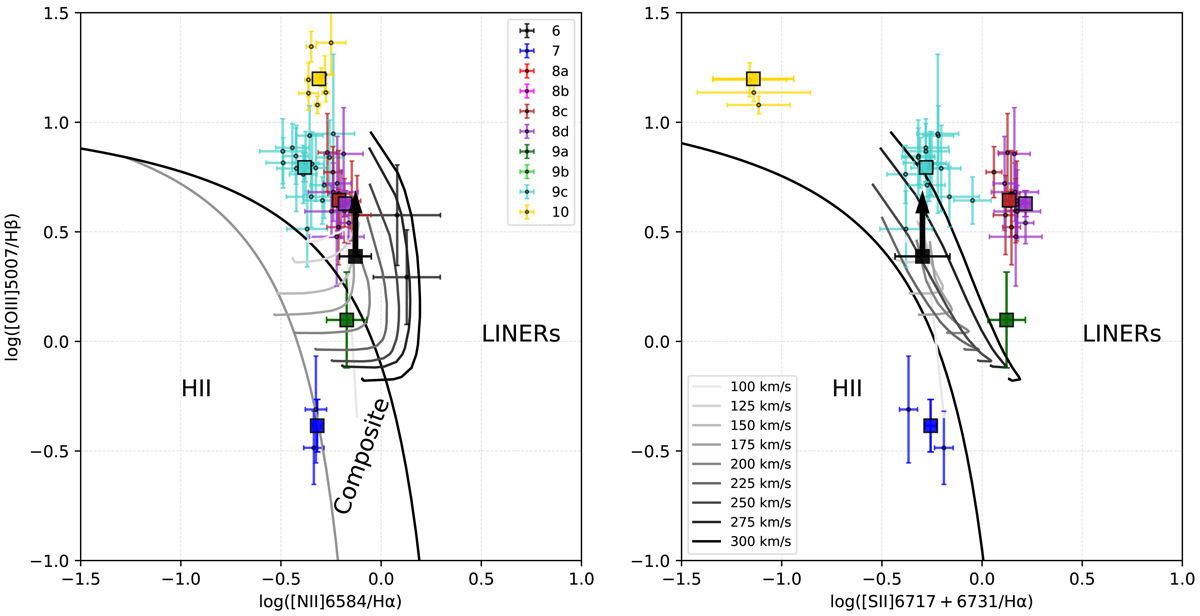
BPT plots [O III]/Hβ versus [N II]/Hα (left) and [O III]/Hβ versus [S II]/Hα (right) with overlaid Kewley et al. (2001) and Kauffmann et al. (2003) separation lines (black and gray, respectively) and MAPPINGS III (Allen et al. 2008) radiative shock models for solar abundances and preshock electron density ne = 10 cm−3. Each pixel along the slit is plotted with a filled circle with error bars. Large squares show results from spectra integrated over the larger area (usually the whole part of the region crossed by the slit). Colors correspond to those pixels lying within the borders of objects. For consistency with colors used in Fig. 12, all objects are listed, whereas BPT plots are constructed from only low-resolution spectra which cover the large spectral range – objects VIEM 6, 7, 8c, 8d, 9a, 9c, and 10.
Current usage metrics show cumulative count of Article Views (full-text article views including HTML views, PDF and ePub downloads, according to the available data) and Abstracts Views on Vision4Press platform.
Data correspond to usage on the plateform after 2015. The current usage metrics is available 48-96 hours after online publication and is updated daily on week days.
Initial download of the metrics may take a while.