Fig. 10.
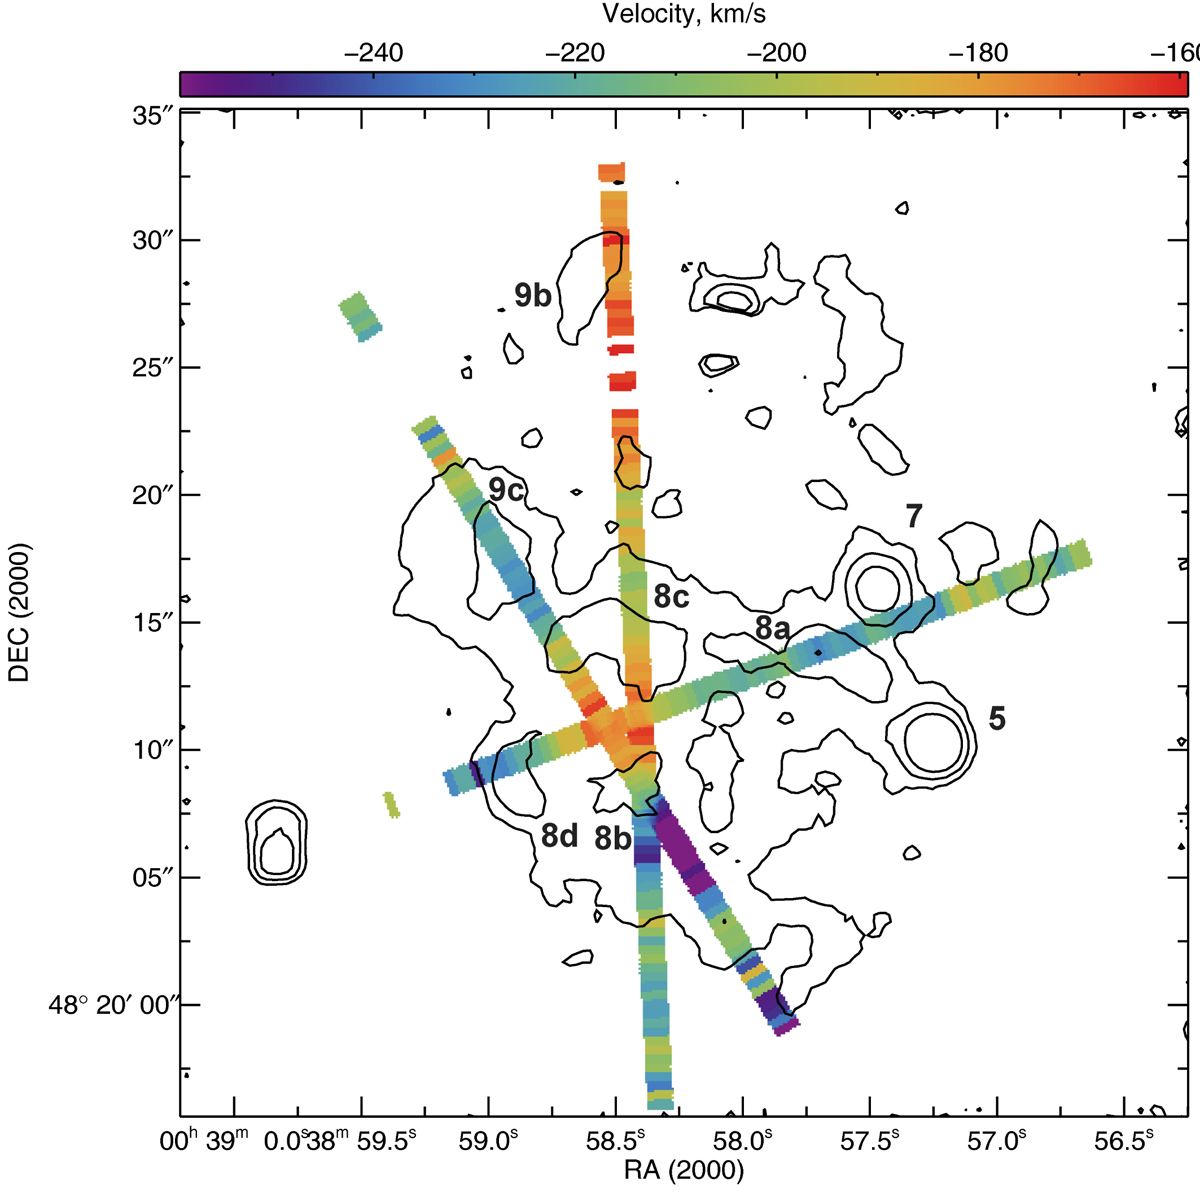
Two-dimensional velocity map in the Hα line of the central 40″ × 40″ of NGC 185, constructed from three slit positions for high-resolution spectra, with objects denoted as in Fig. 2. Contours denote Hα intensity from narrowband imaging. Assuming that heliocentric velocity of the galaxy is −203.8 km s−1 (McConnachie 2012), we observe the receding side of shells VIEM 8 and VIEM 9.
Current usage metrics show cumulative count of Article Views (full-text article views including HTML views, PDF and ePub downloads, according to the available data) and Abstracts Views on Vision4Press platform.
Data correspond to usage on the plateform after 2015. The current usage metrics is available 48-96 hours after online publication and is updated daily on week days.
Initial download of the metrics may take a while.