Fig. 8.
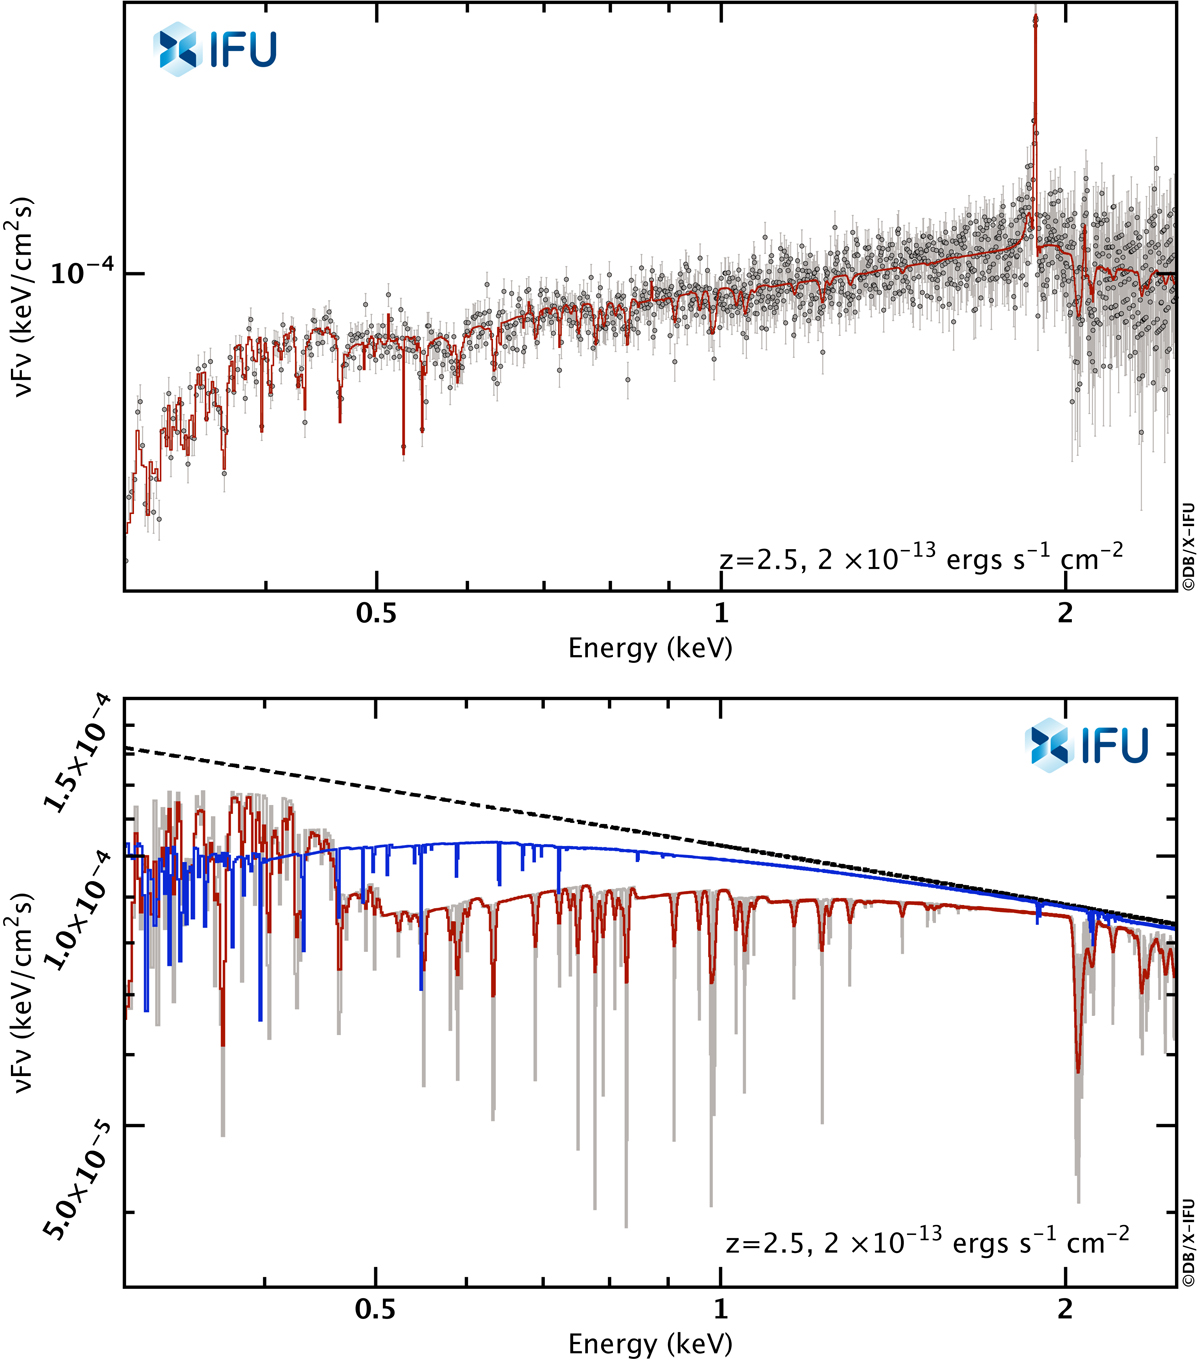
Top: energy spectrum of a high-redshift AGN (z = 2.5) observed with X-IFU for 100 ks. Bottom: incident power-law spectrum (reflection component removed, black dashed line) to highlight the imprints of the absorbers. The low-density, low-ionization absorber is shown with the blue curve (NH = 0.9 × 1022 cm−2, logξ = 1.8) at a redshift of 2.46. The high-density, high-velocity absorber (NH = 7.1 × 1022 cm−2, logξ = 2.9) whose redshift is 2.33 is shown without smearing in gray. A velocity broadening normalized to 1000 km s−1 at 6 keV (rest frame) has been assumed and smears out the absorber features (red line). The black hole spin has been assumed to be 0.5. The iron abundance has been set to 1. Fitting such a spectrum would enable the redshift to the source and the velocity of the outflow to be measured with an extremely high accuracy of ∼0.001 and ∼0.01, respectively (statistical error only). This is due to the strong narrow iron line produced by the distant reflector and the large number of absorption lines due the two absorbers.
Current usage metrics show cumulative count of Article Views (full-text article views including HTML views, PDF and ePub downloads, according to the available data) and Abstracts Views on Vision4Press platform.
Data correspond to usage on the plateform after 2015. The current usage metrics is available 48-96 hours after online publication and is updated daily on week days.
Initial download of the metrics may take a while.