Fig. 11.
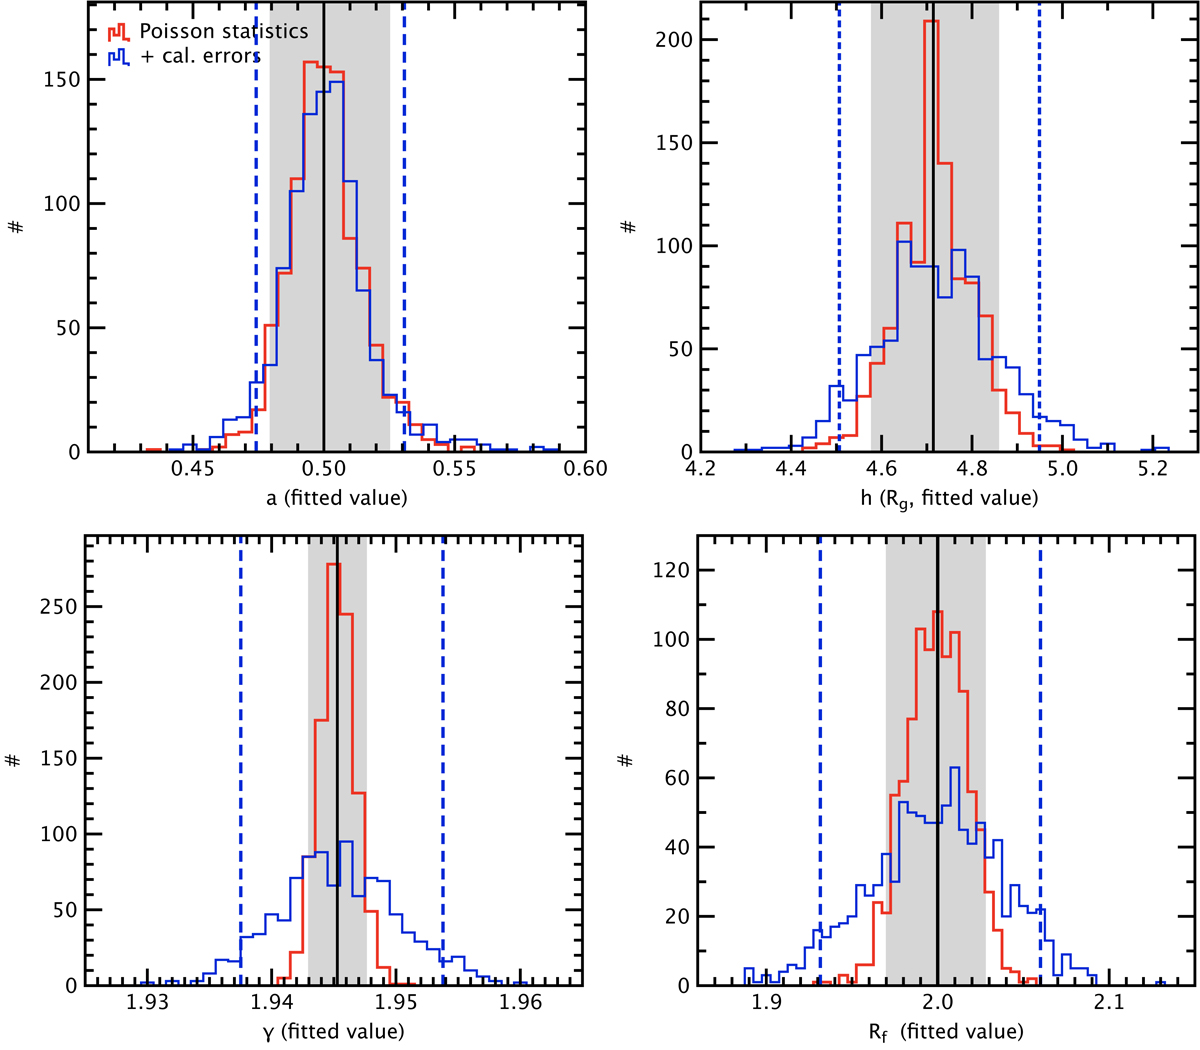
Histogram distribution of best-fit parameters arising from Poisson statistics alone (in red, the 90% quantile is indicated with the gray area) and from Poisson statistics and calibration errors (in blue, the 90% quantile is delimited with the blue dashed line). Top-left: spin parameter. Top-right: height of the irradiating source. Bottom-left: power law index. Bottom-right: reflection fraction. The case simulated here corresponds to a spin of 0.5, a 1 mCrab source observed for 100 ks, with a reflection fraction set to two. As can be seen, at the level of calibration errors considered here, the spin parameter and the height of the X-ray source do not suffer from any significant systematic error, while the systematic errors on the power-law index and reflection fraction are larger, but remain small. No biases are introduced in all cases; see Sect. 5.
Current usage metrics show cumulative count of Article Views (full-text article views including HTML views, PDF and ePub downloads, according to the available data) and Abstracts Views on Vision4Press platform.
Data correspond to usage on the plateform after 2015. The current usage metrics is available 48-96 hours after online publication and is updated daily on week days.
Initial download of the metrics may take a while.