Fig. 10.
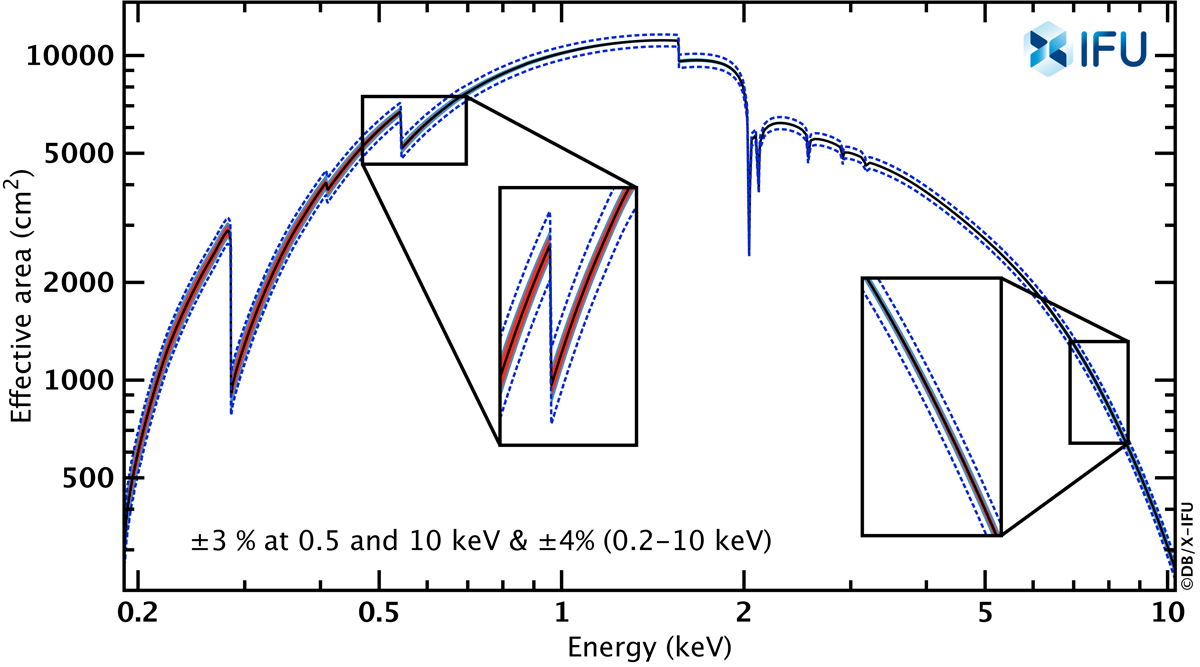
Envelope of the X-IFU responses considered to assess the potential systematics related to calibration uncertainties. The 3% (1σ) on the relative broad band effective area is shown in filled red around the nominal response which is indicated with a solid black line. The 4% (1σ) on the absolute effective area knowledge is delimited by the blue dashed line and comes on top of the previous one. 1000 response files are drawn from within the envelope, assuming non truncated normal distributions. See Sect. 5 for details about the method.
Current usage metrics show cumulative count of Article Views (full-text article views including HTML views, PDF and ePub downloads, according to the available data) and Abstracts Views on Vision4Press platform.
Data correspond to usage on the plateform after 2015. The current usage metrics is available 48-96 hours after online publication and is updated daily on week days.
Initial download of the metrics may take a while.