Fig. 7
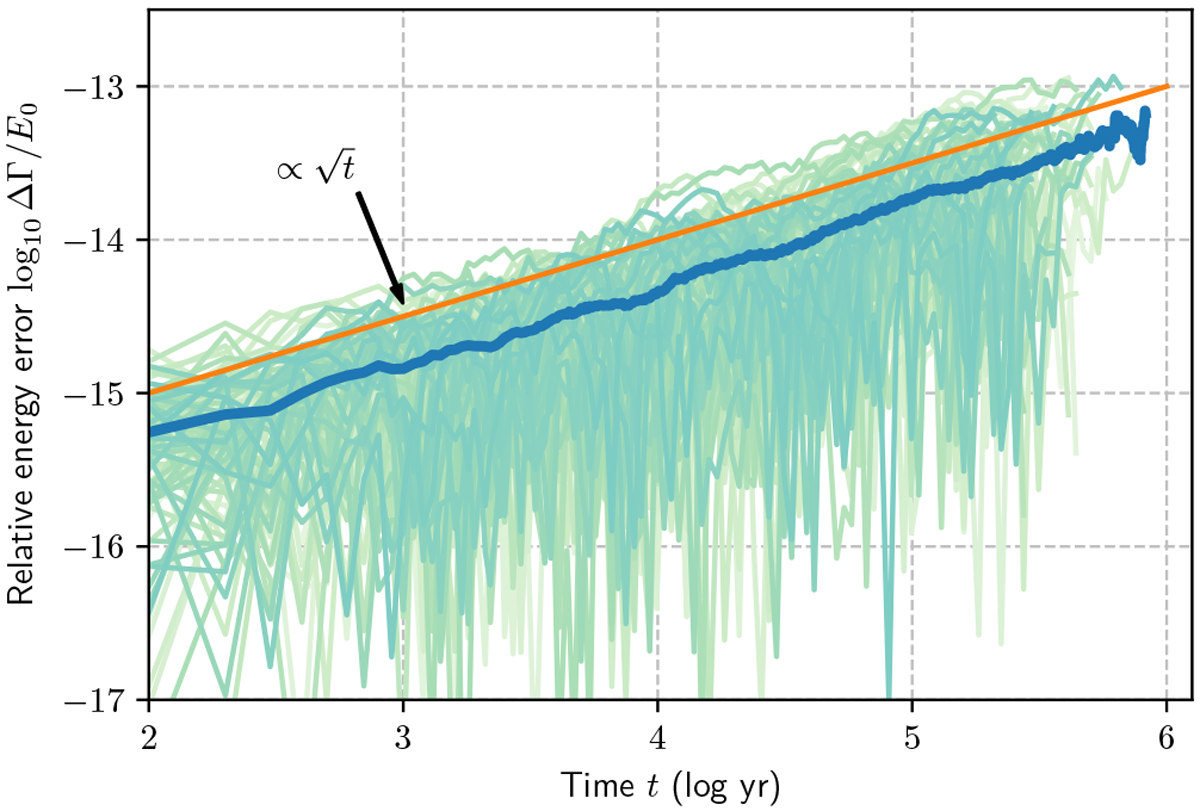
Evolution of the relative energy error for 100 systems composed of six planets on initially circular orbits. The light curves represent individual systems, and the thicker blue curves show the average over the 100 systems. The orange straight line is proportional to
![]() in order to show that the integrator follows Brouwer’s law. The orange line is the same in all energy error figures for comparison.
in order to show that the integrator follows Brouwer’s law. The orange line is the same in all energy error figures for comparison.
Current usage metrics show cumulative count of Article Views (full-text article views including HTML views, PDF and ePub downloads, according to the available data) and Abstracts Views on Vision4Press platform.
Data correspond to usage on the plateform after 2015. The current usage metrics is available 48-96 hours after online publication and is updated daily on week days.
Initial download of the metrics may take a while.