Fig. 5.
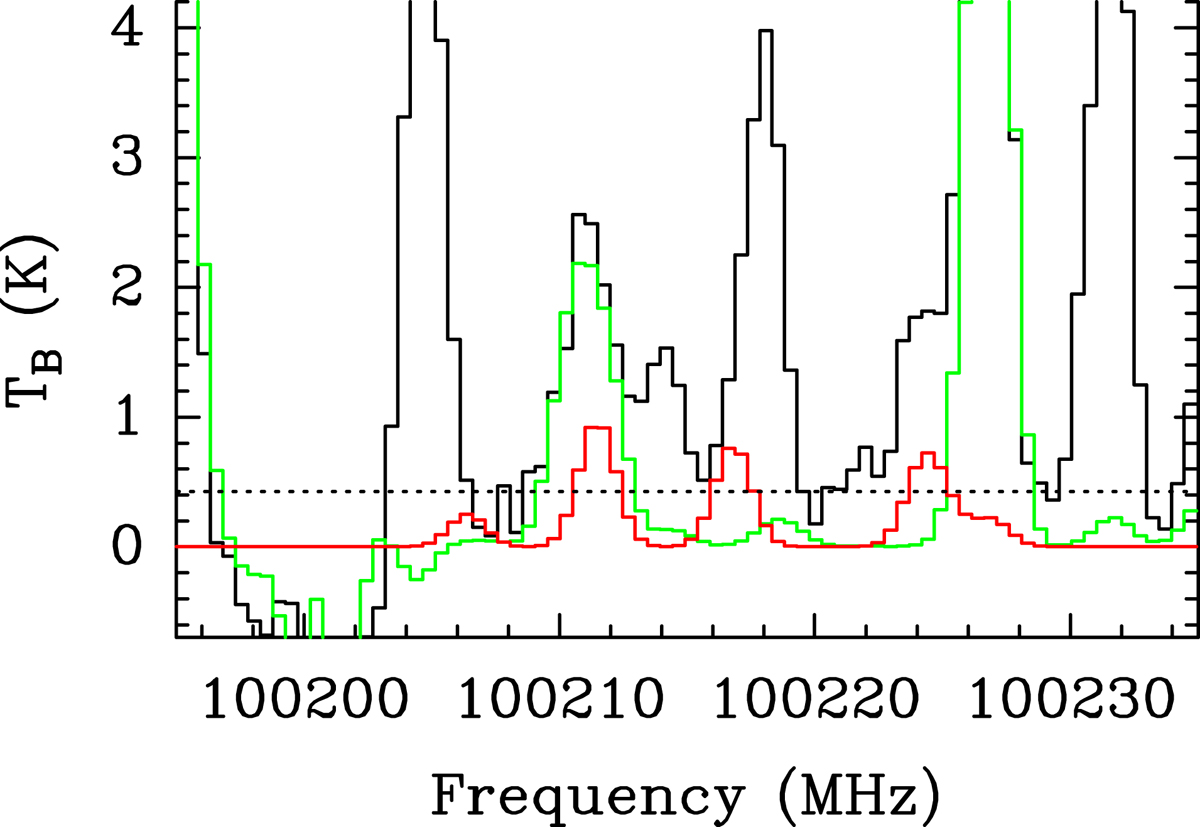
Portion of the EMoCA survey around 102.2 GHz. The best-fit LTE synthetic spectrum that contains the contributions of all molecules identified so far towards Sgr B2(N2) is overlaid in green on the observed spectrum, which is shown in black. The synthetic spectrum of imidazole used to derived the upper limit on its column density is shown in red. The y-axis is labelled in brightness temperature units. The dotted line indicates the 3σ noise level.
Current usage metrics show cumulative count of Article Views (full-text article views including HTML views, PDF and ePub downloads, according to the available data) and Abstracts Views on Vision4Press platform.
Data correspond to usage on the plateform after 2015. The current usage metrics is available 48-96 hours after online publication and is updated daily on week days.
Initial download of the metrics may take a while.