Fig. 3.
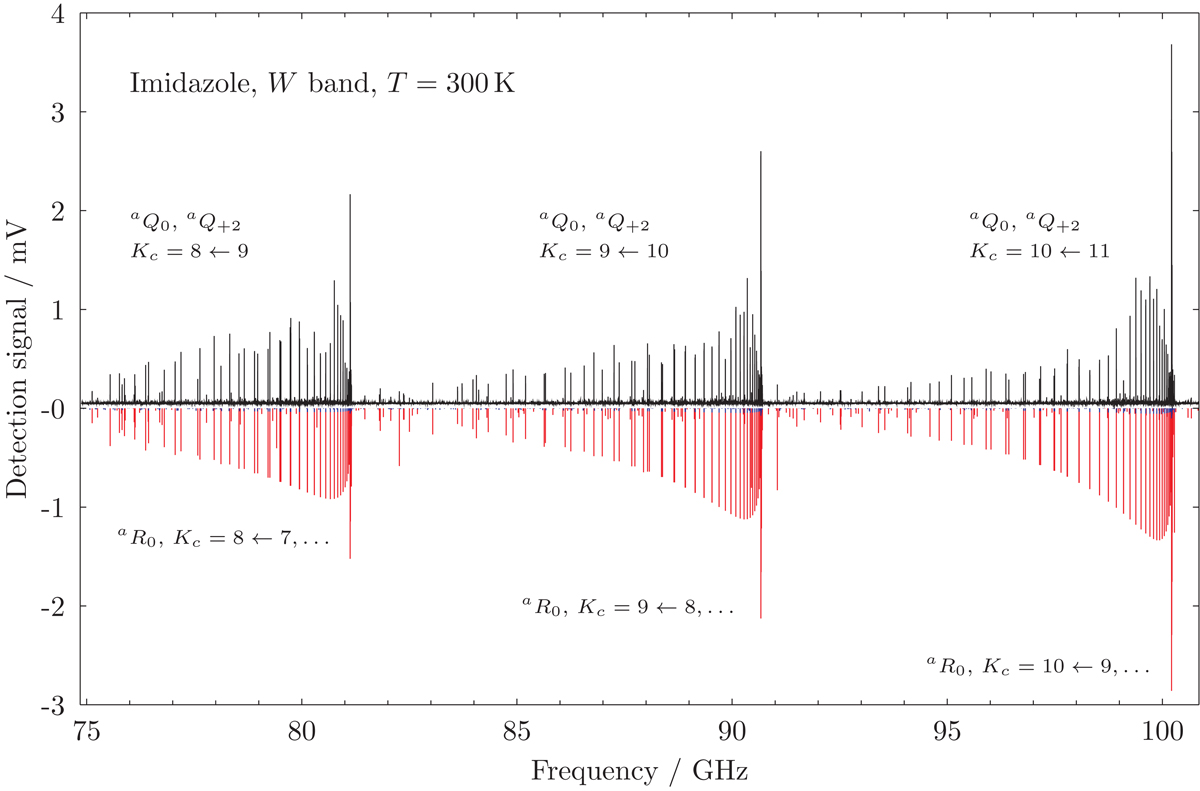
Recording (black trace) of the imidazole rotational spectrum in the 3 mm region taken with the W-band segmented chirped-pulse spectrometer at DESY. The red histogram (inverted) indicates the predicted positions of the a-type lines computed using the spectroscopic parameters of Table 2. The b-type transitions (blue trace) are very weak and barely visible in the used y-axis scale.
Current usage metrics show cumulative count of Article Views (full-text article views including HTML views, PDF and ePub downloads, according to the available data) and Abstracts Views on Vision4Press platform.
Data correspond to usage on the plateform after 2015. The current usage metrics is available 48-96 hours after online publication and is updated daily on week days.
Initial download of the metrics may take a while.