Fig. C.1.
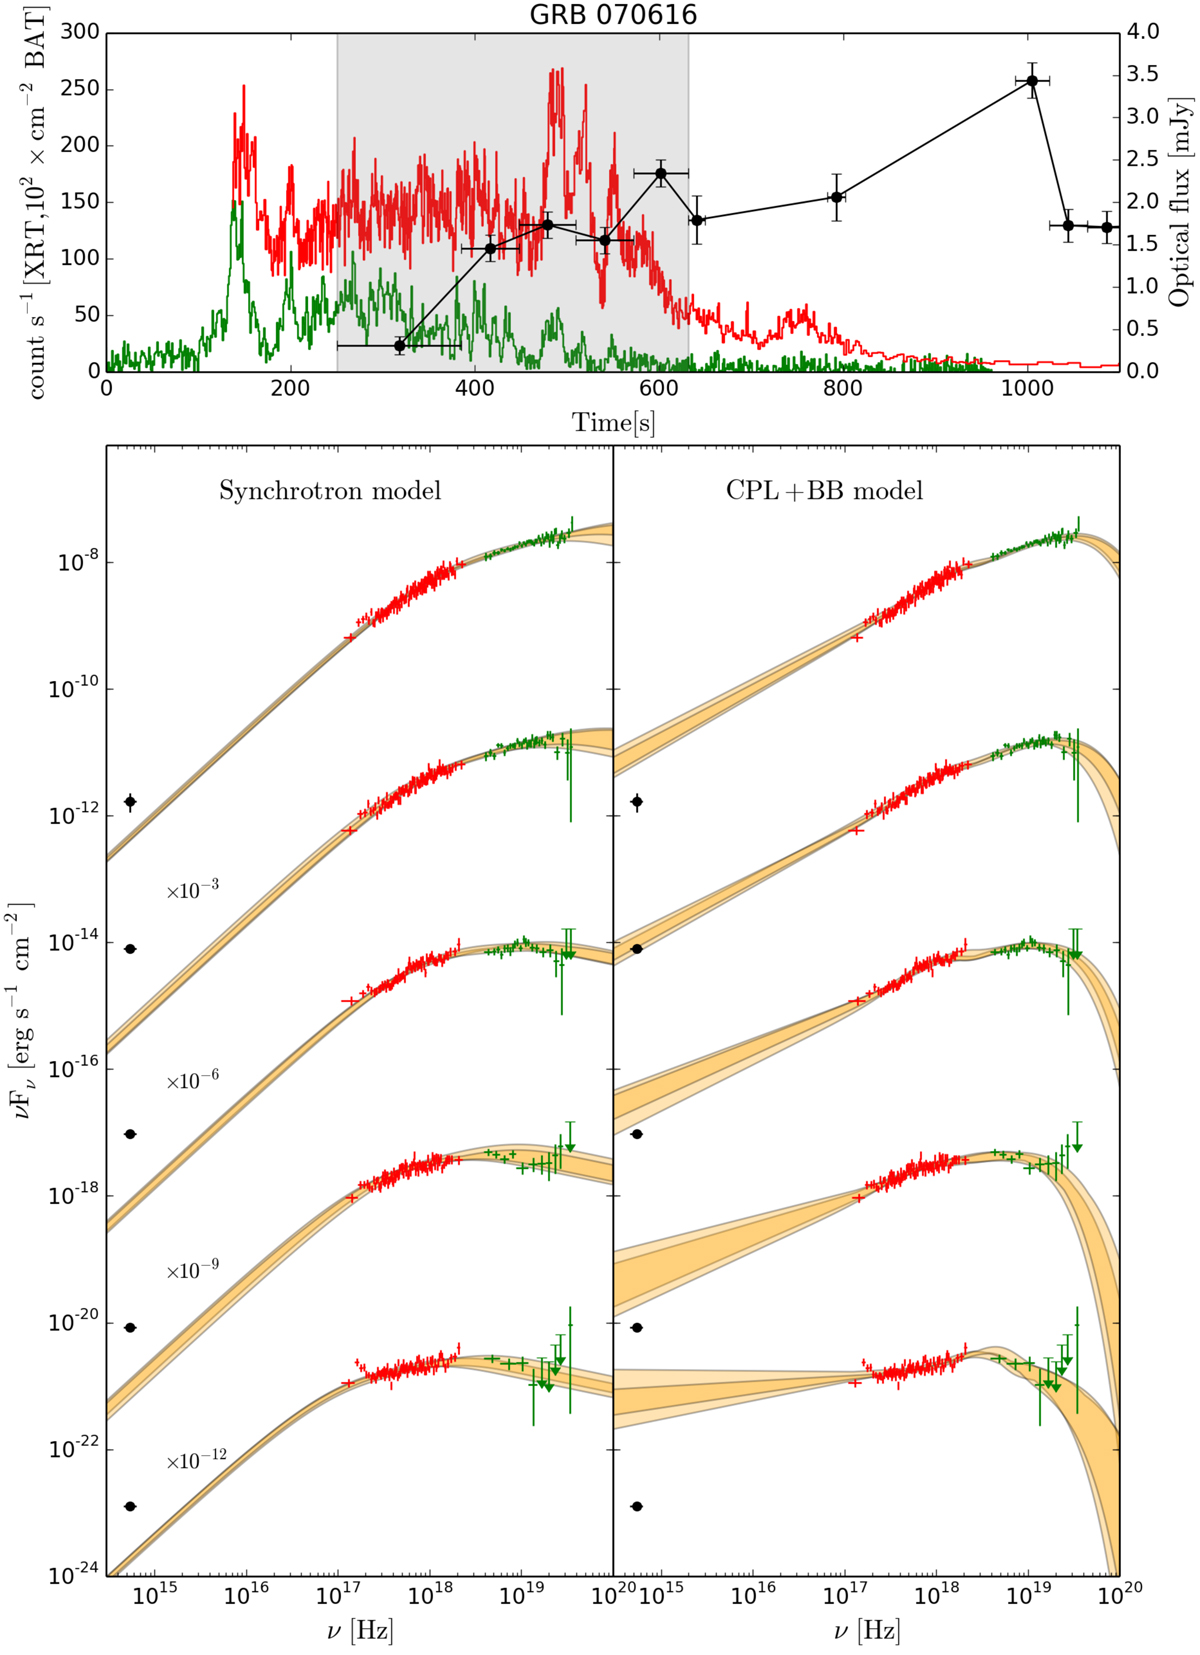
Results of the time-resolved spectral analysis of three GRBs with multi-epoch optical observations and no evident correlation between X-ray and optical variability. For each GRB the upper panel shows the XRT (red), BAT (green), GBM (blue, if available), and optical (black) light curves. The shaded grey region corresponds to the time window where the joint XRT and BAT (and GBM) spectral analysis is performed. The time-bins for the spectral analysis are defined by the optical exposure times. The synchrotron and BB+CPL fits are shown in the left and right bottom panels, respectively. For clarity purposes, spectra are shifted along the vertical axis by multiplicative factors, as specified. The XRT flux has been de-absorbed. The best-fit contour regions are shown in orange: light orange is used for the best-fit model derived when the calibration constant was fixed to BAT data, and dark orange when it was fixed to XRT data. The optical fluxes for each time-bin (in black) are added to compare with the low-energy extrapolation of the synchrotron and BB+CPL models.
Current usage metrics show cumulative count of Article Views (full-text article views including HTML views, PDF and ePub downloads, according to the available data) and Abstracts Views on Vision4Press platform.
Data correspond to usage on the plateform after 2015. The current usage metrics is available 48-96 hours after online publication and is updated daily on week days.
Initial download of the metrics may take a while.