Fig. A.2.
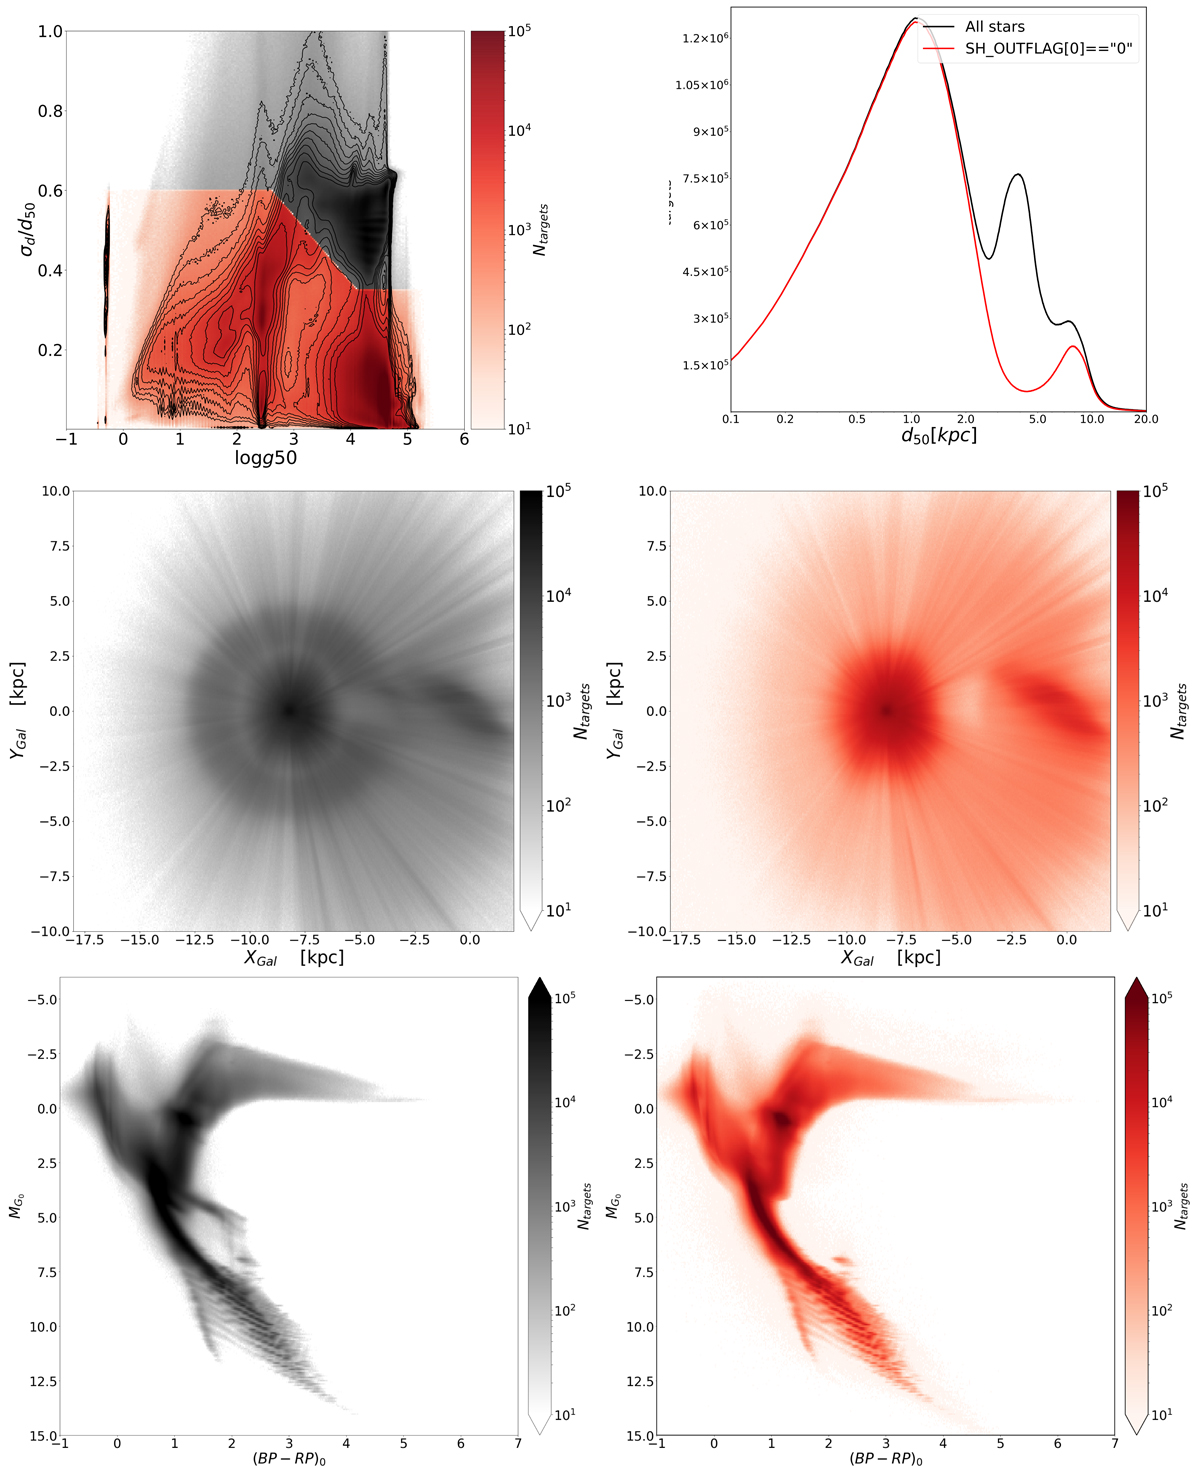
Illustration of the main StarHorse reliability flag, SH_OUTFLAG[0], corresponding to a cut in the σd/d50 vs. log g50 diagram (top left panel). In each panel, the coloured distribution corresponds to converged stars with SH_OUTFLAG[0]==“0”, while the grey distribution corresponds to all stars. Top right panel: distance histograms for the two samples, and middle panels: density in Galactic XY co-ordinates, highlighting the “bloody-eye” effect of stars with poorly-constrained posterior distances that disappear when applying the reliability flag. Bottom panels: CMDs of both samples, highlighting the disappearance of the nose feature when applying the reliability flag.
Current usage metrics show cumulative count of Article Views (full-text article views including HTML views, PDF and ePub downloads, according to the available data) and Abstracts Views on Vision4Press platform.
Data correspond to usage on the plateform after 2015. The current usage metrics is available 48-96 hours after online publication and is updated daily on week days.
Initial download of the metrics may take a while.