Fig. 18.
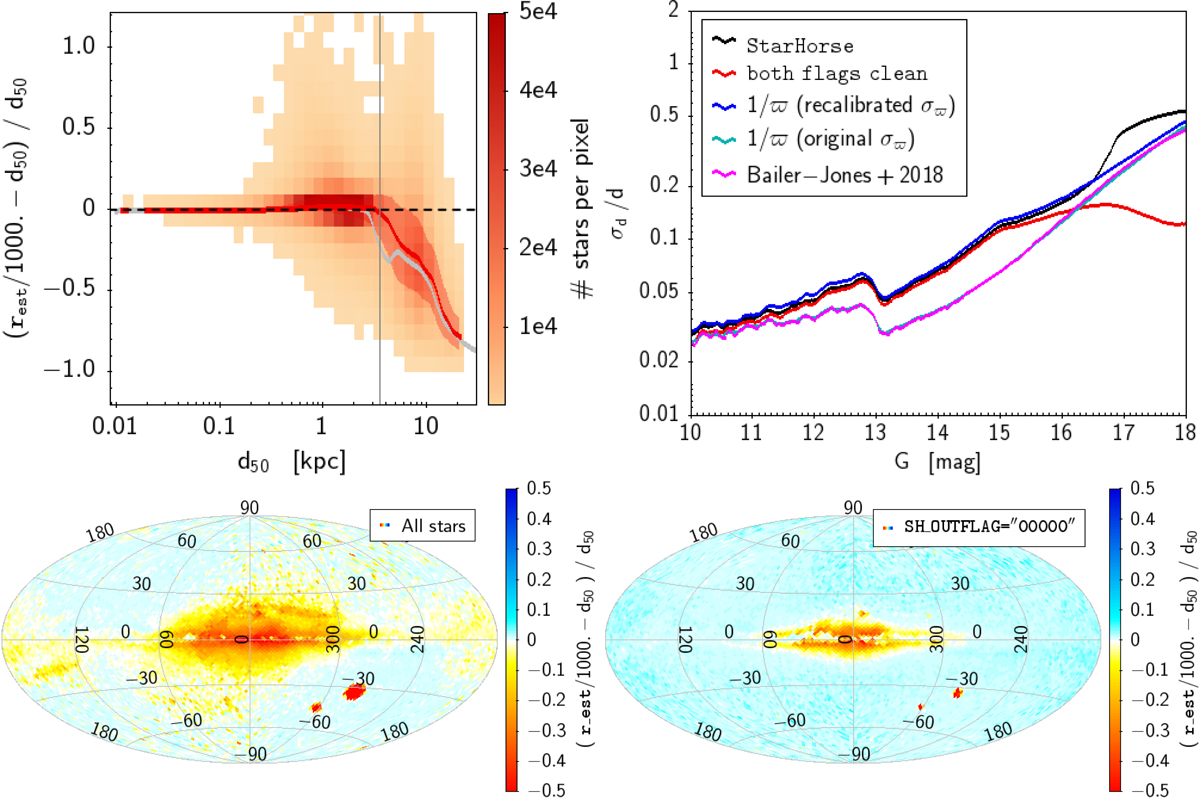
Comparison of StarHorse results with the Gaia DR2-only-derived distances of Bailer-Jones et al. (2018). Top left and bottom panels: median relative differences with respect to our results. Top left panel: median difference as a function of distance. The red density distribution and the running median correspond to the flag-cleaned results, while the grey running median corresponds to the full converged sample. Bottom panels: dependence on sky position for the full sample (left) and filtering on the SH_OUTFLAG (right). Top right: comparison of statistical uncertainties. See Sect. 6.1 for details.
Current usage metrics show cumulative count of Article Views (full-text article views including HTML views, PDF and ePub downloads, according to the available data) and Abstracts Views on Vision4Press platform.
Data correspond to usage on the plateform after 2015. The current usage metrics is available 48-96 hours after online publication and is updated daily on week days.
Initial download of the metrics may take a while.