Fig. 1.
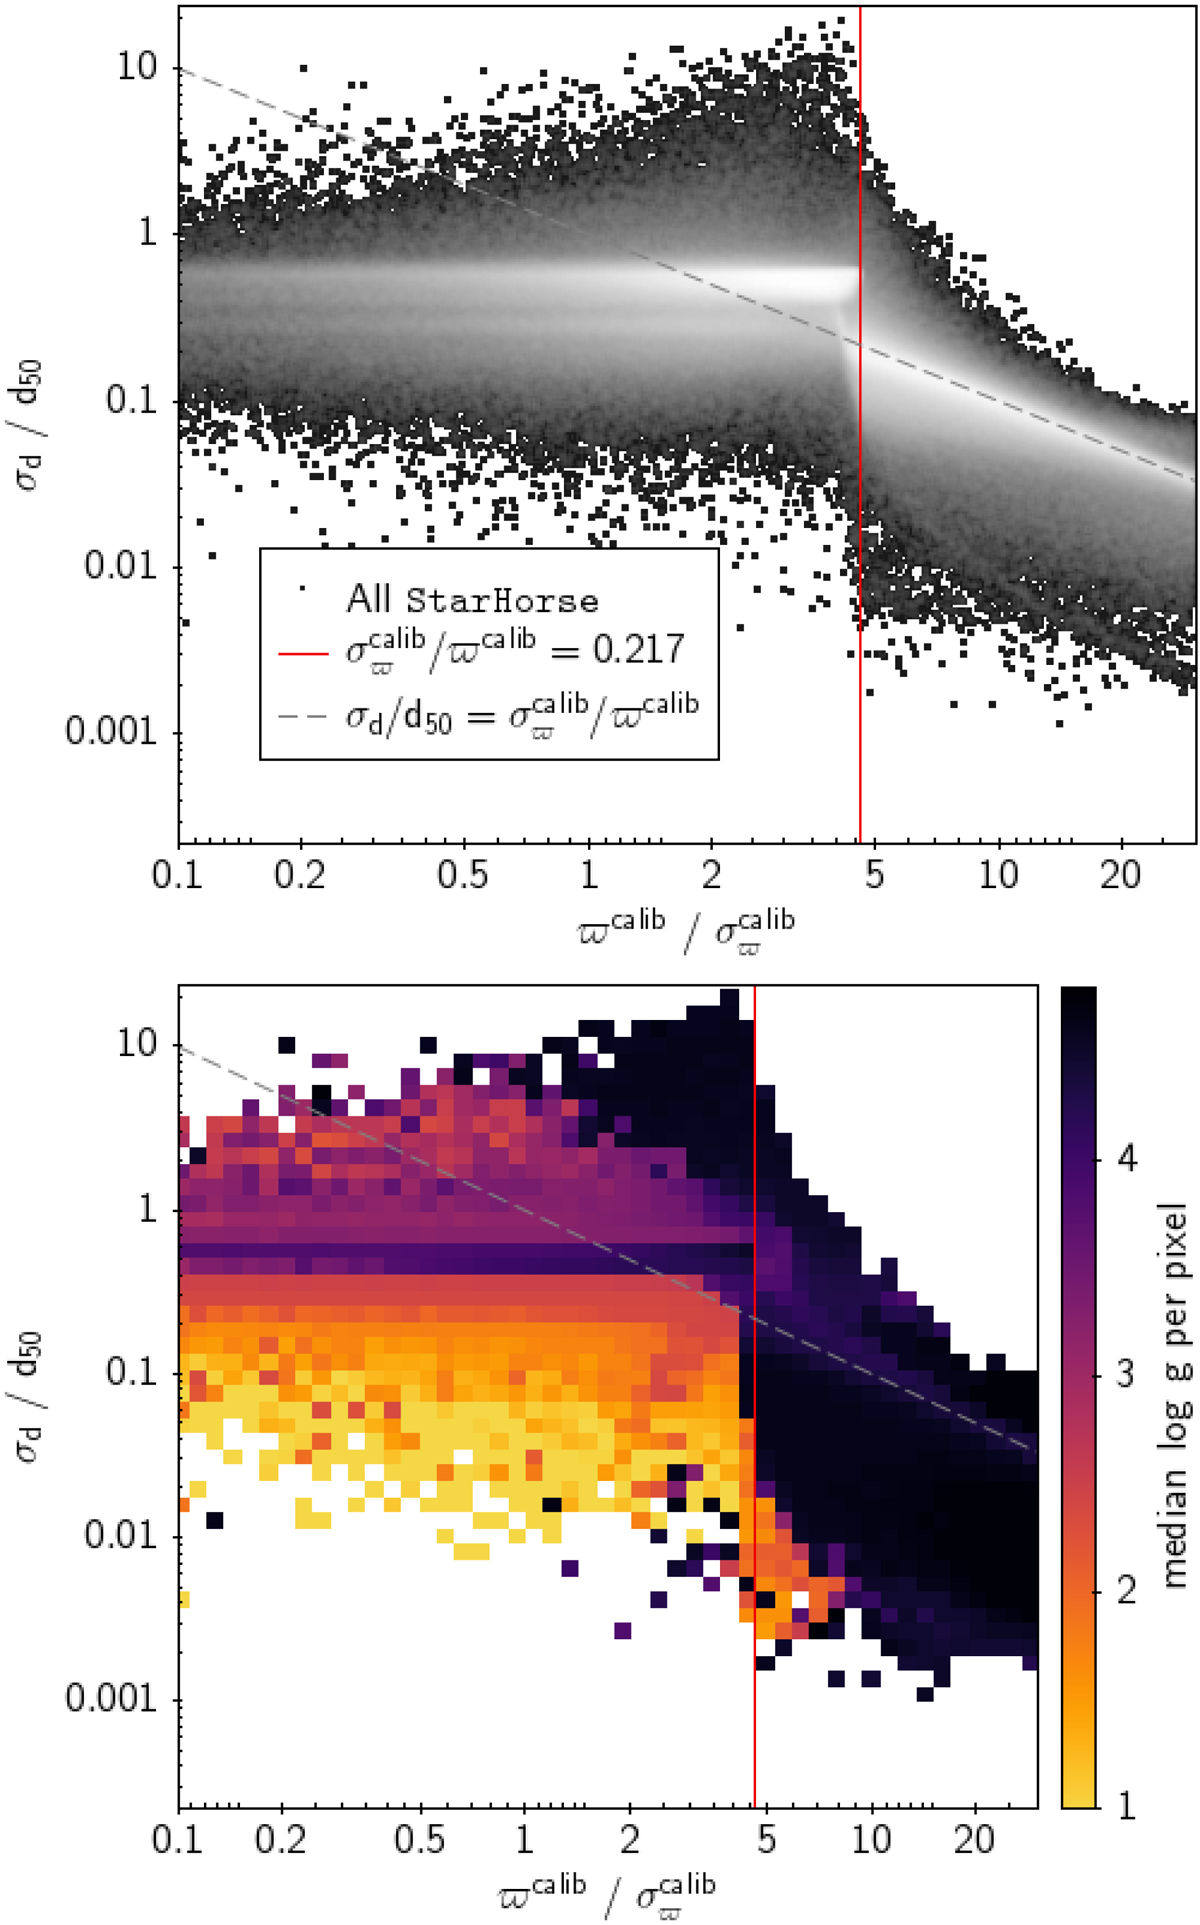
Dependence of StarHorse posterior distance uncertainty on the (recalibrated) Gaia DR2 parallax uncertainty. Top: density plot. Bottom: coloured by median log g in each pixel. The grey dashed line indicates unity, the red vertical line indicates the approximate value below which the inverse parallax PDF becomes seriously biased and noisy (see Bailer-Jones 2015).
Current usage metrics show cumulative count of Article Views (full-text article views including HTML views, PDF and ePub downloads, according to the available data) and Abstracts Views on Vision4Press platform.
Data correspond to usage on the plateform after 2015. The current usage metrics is available 48-96 hours after online publication and is updated daily on week days.
Initial download of the metrics may take a while.