Fig. 9
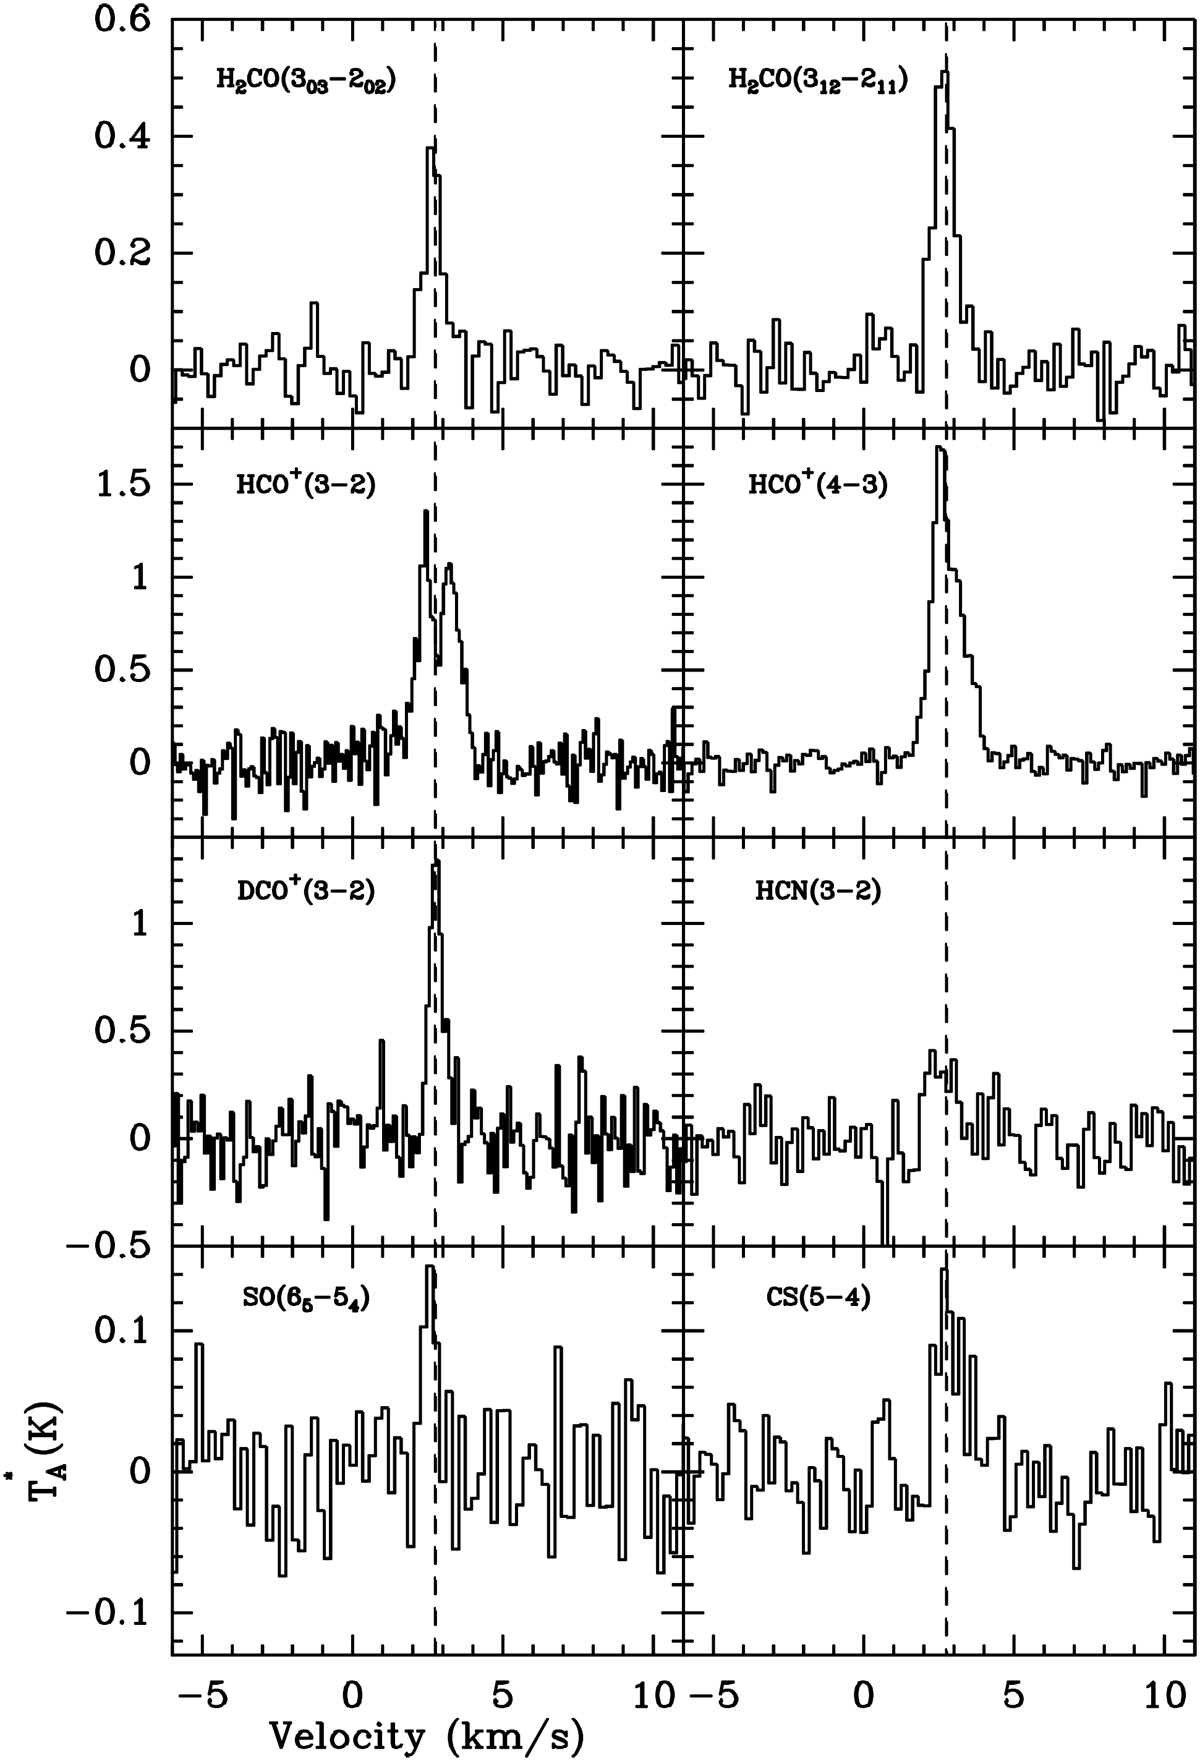
JCMT data. Spectra of various molecular lines at the position of the YSO. The H2 CO(322 − 221) transition was not detected and is not shown (see Table 2). The HCN-spectrum has been Hanning-smoothed to a twice lower resolution with respect to the value in Table 2; the rmsin the spectrum shown is 0.14 K. The dashed line indicates the velocity of the quiescent gas (2.75 km s−1).
Current usage metrics show cumulative count of Article Views (full-text article views including HTML views, PDF and ePub downloads, according to the available data) and Abstracts Views on Vision4Press platform.
Data correspond to usage on the plateform after 2015. The current usage metrics is available 48-96 hours after online publication and is updated daily on week days.
Initial download of the metrics may take a while.