Fig. 8
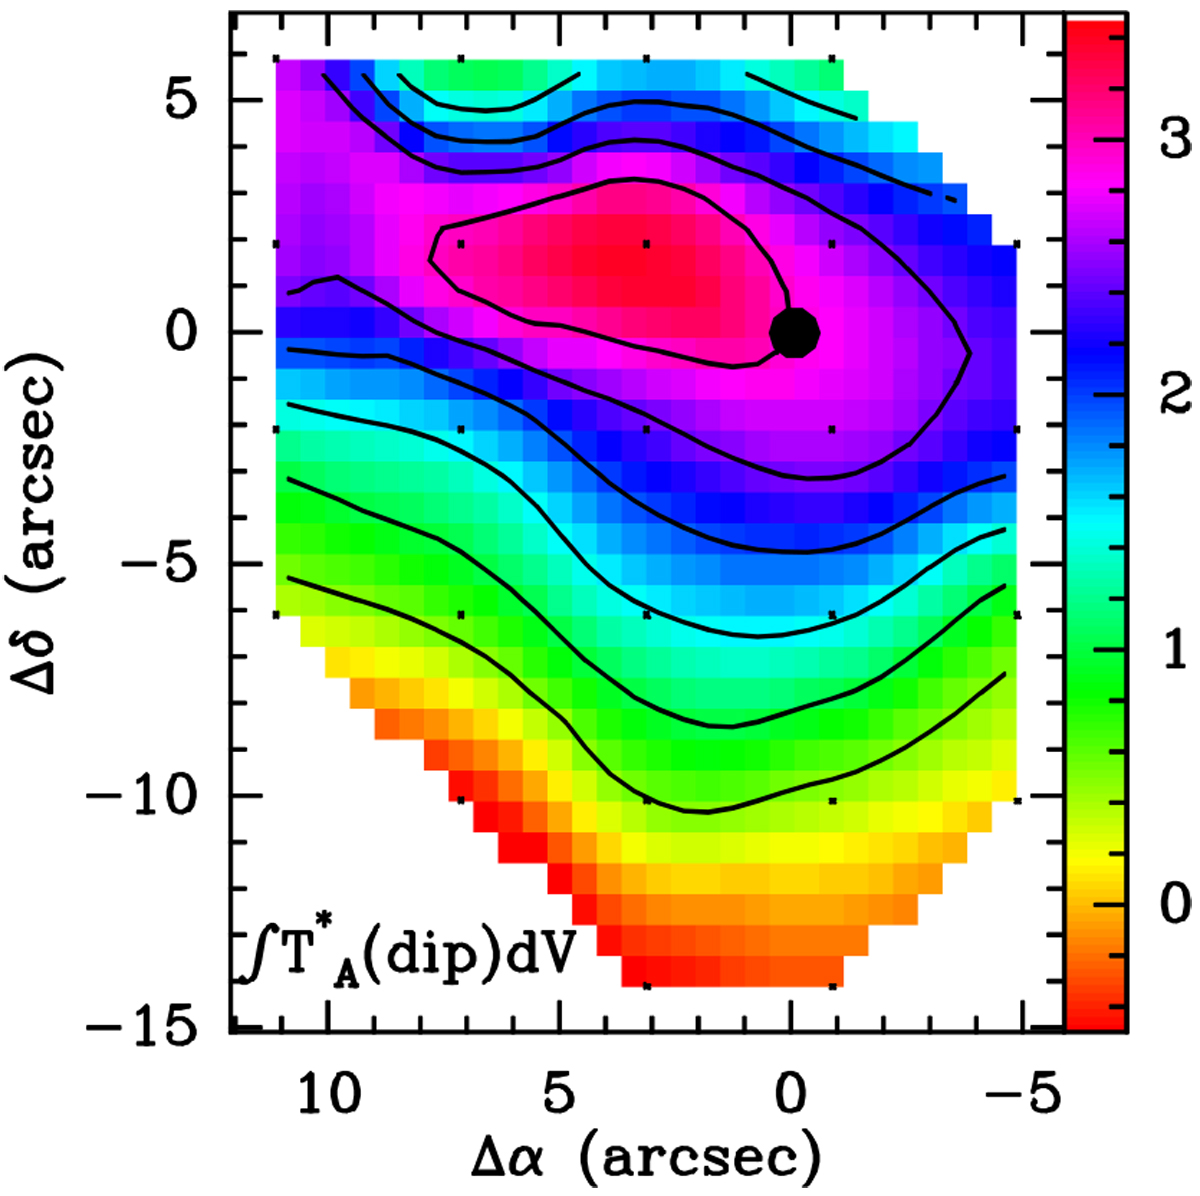
Distribution of the area of the “dip” in the 12CO(2–1) profiles; IRAM data. Contours (lowest(step)highest) are 0.5(0.5)3.5 K km s−1. A Gaussian curve was fitted to each profile (ignoring the “dip” and wings); the fitted profile was subtracted from the original and the result multiplied by −1. The residual was then integrated between 1.3 and 3.4 km s−1. The filled circle indicates the position of the sub-mm peak (see Figs. 2, 3). Offsets are relative to the 2MASS position of the YSO (see Table 1).
Current usage metrics show cumulative count of Article Views (full-text article views including HTML views, PDF and ePub downloads, according to the available data) and Abstracts Views on Vision4Press platform.
Data correspond to usage on the plateform after 2015. The current usage metrics is available 48-96 hours after online publication and is updated daily on week days.
Initial download of the metrics may take a while.