Fig. 5
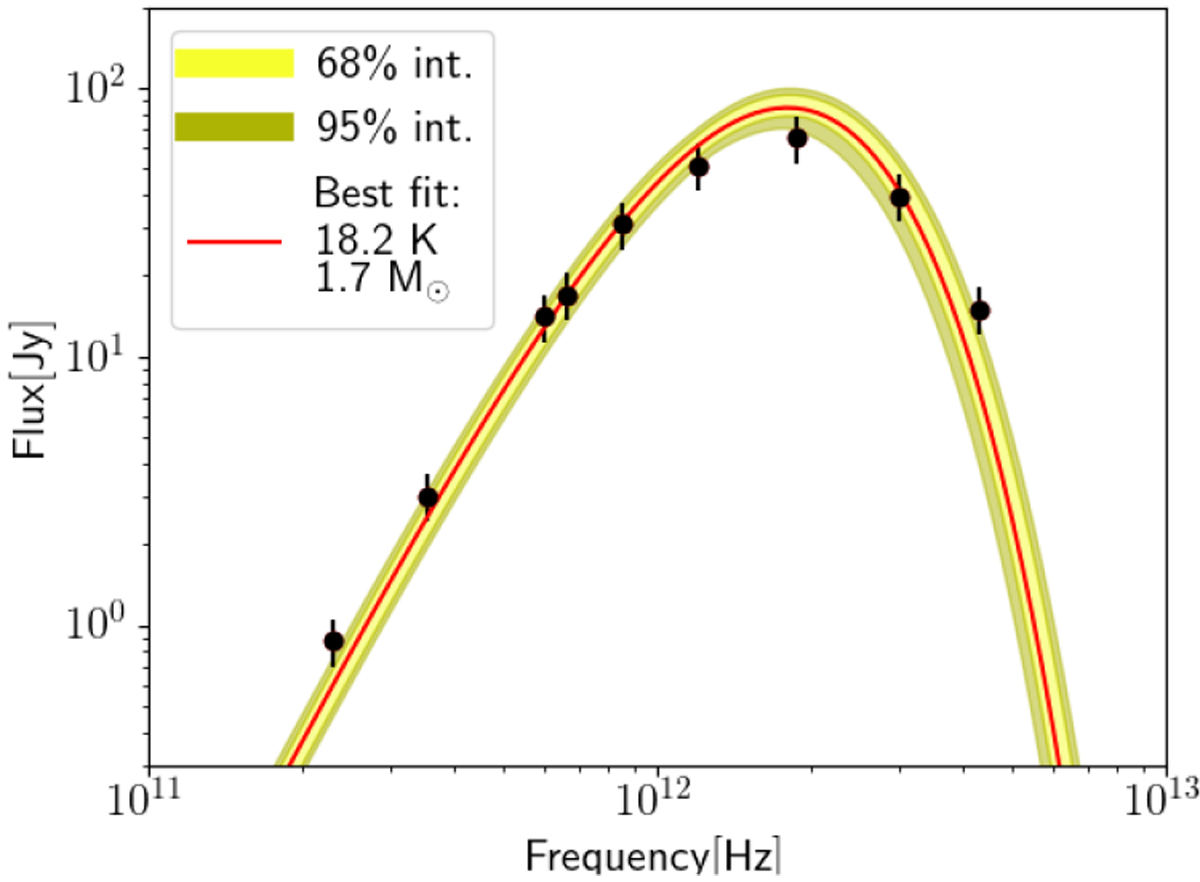
Spectral energy distribution (SED) of CB230. The data shown are the SCUBA-2 measurements at 450 and 850 μm (corrected for CO(3–2)-emission), the integrated flux at 1.3 mm (Launhardt et al. 2010), and the Herschel data points at 70, 100, 160, 250, 350 and 500 μm (extracted from Fig. 4 in Launhardt et al. 2013). The fit to the data (red) was obtained by assuming a dust optical depth at 870 μm of 1.85 cm2g−1, and a dust absorption coefficient β of 1.8. The yellow and green bands indicate the uncertainty in the modelled fluxes for the 68 and 95% credibility intervals of Tdust and Mdust, assuming that the uncertainty on the measured fluxes is 20%.
Current usage metrics show cumulative count of Article Views (full-text article views including HTML views, PDF and ePub downloads, according to the available data) and Abstracts Views on Vision4Press platform.
Data correspond to usage on the plateform after 2015. The current usage metrics is available 48-96 hours after online publication and is updated daily on week days.
Initial download of the metrics may take a while.