Free Access
Fig. 3
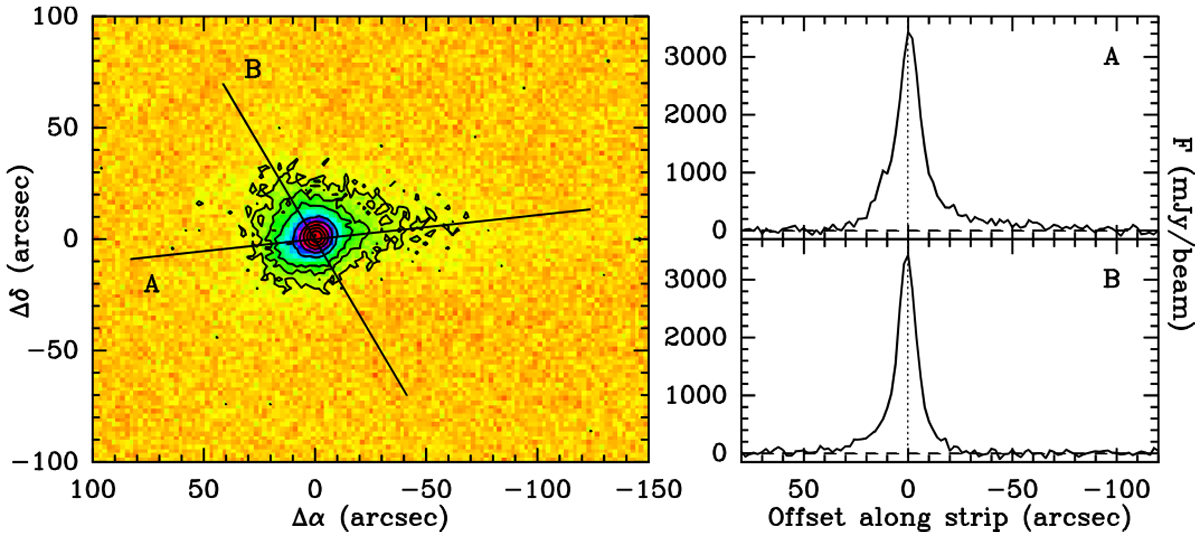
SCUBA-2 map of the dust continuum emission at 450 μm (left panel), and profiles along cuts A and B. The 450 μm peak is at (0′′,2′′). Contours (lowest(step)highest) are 150, 300, 500(500)3500 mJy beam−1. The rms noise is 50 mJy beam−1.
Current usage metrics show cumulative count of Article Views (full-text article views including HTML views, PDF and ePub downloads, according to the available data) and Abstracts Views on Vision4Press platform.
Data correspond to usage on the plateform after 2015. The current usage metrics is available 48-96 hours after online publication and is updated daily on week days.
Initial download of the metrics may take a while.