Fig. 20
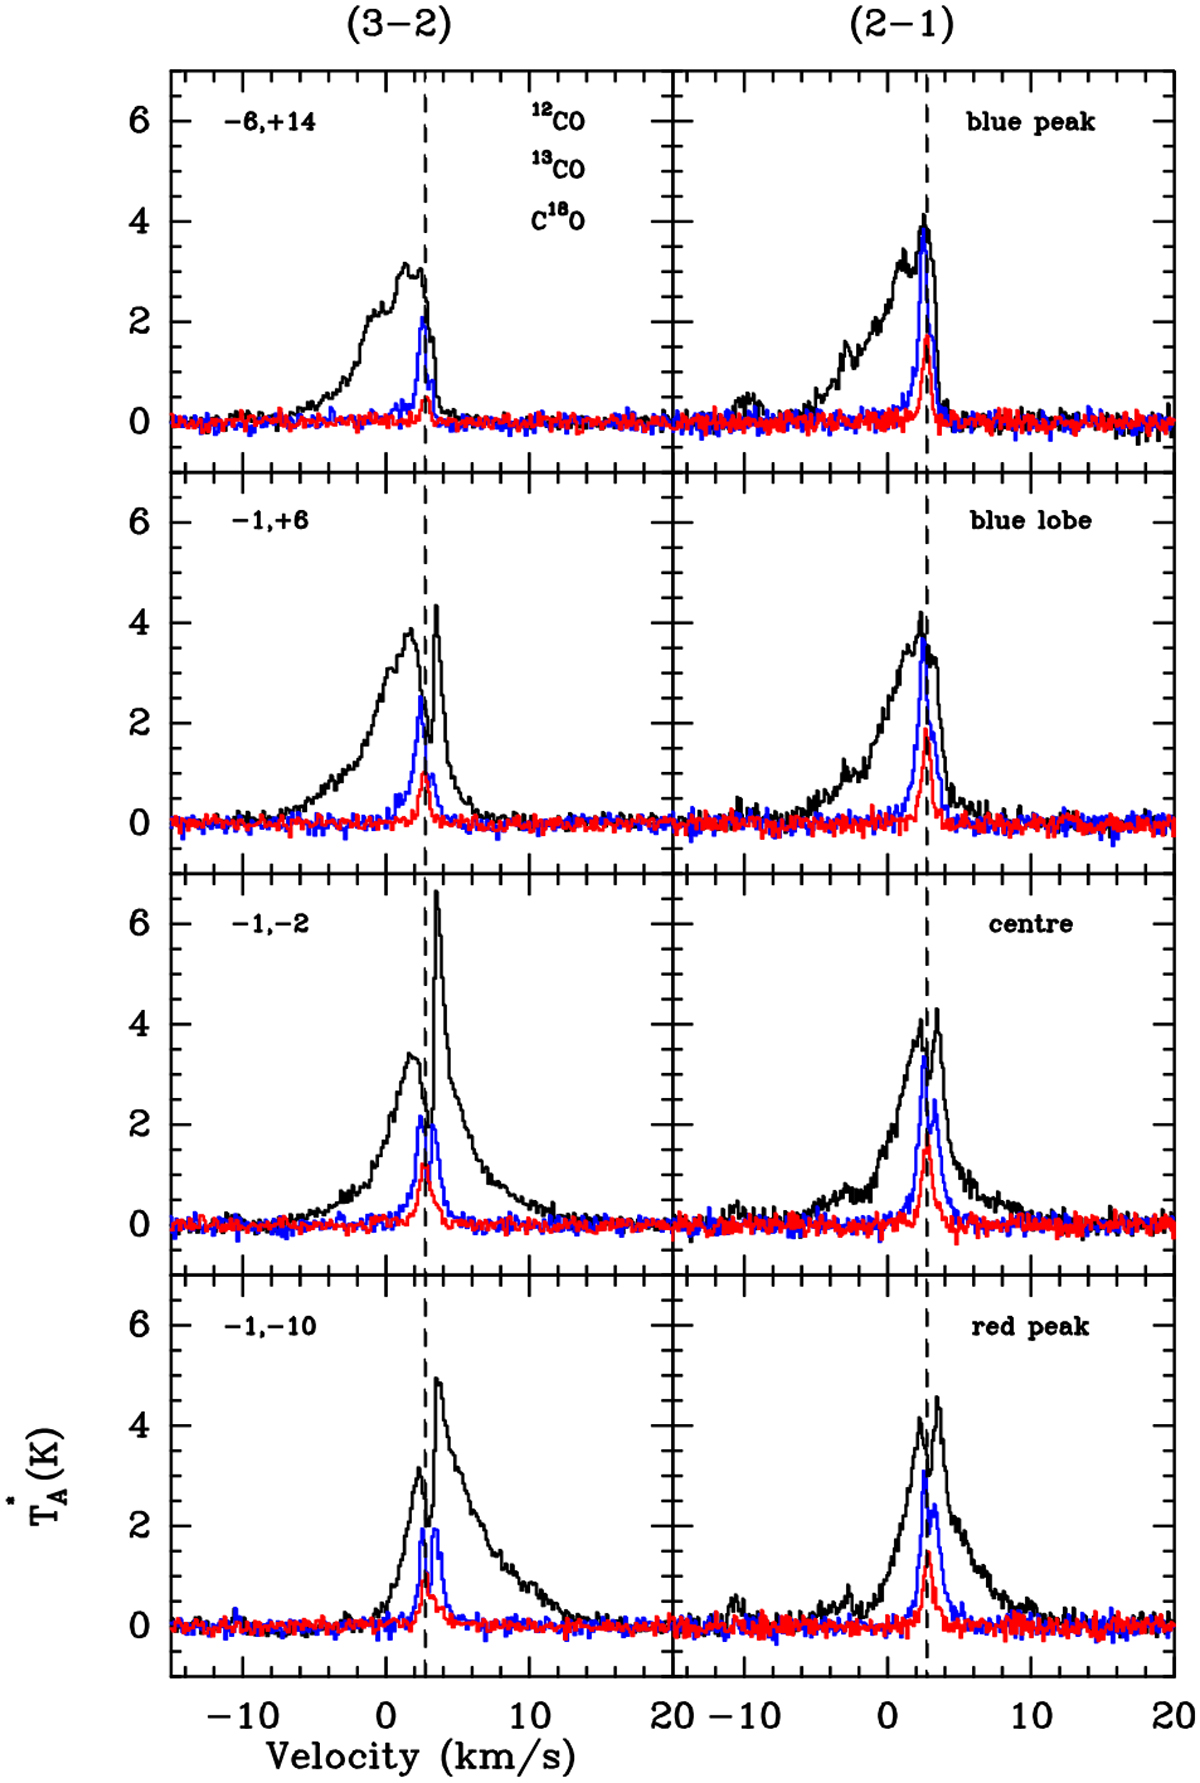
JCMT data. Comparison of J = 3–2 (left) and J = 2–1 (right) spectra at four positions of 12CO (black), 13CO (blue), and C18O (red). The widest and most intense emission is that of 12CO, the narrowest and weakest emission profile is that of C18O. The dashed line indicates the velocity (2.75 km s−1) of the quiescent gas (see Fig 19). The offsets relative to the 2MASS YSO position are indicated in the left-hand panels (see also Fig. 17).
Current usage metrics show cumulative count of Article Views (full-text article views including HTML views, PDF and ePub downloads, according to the available data) and Abstracts Views on Vision4Press platform.
Data correspond to usage on the plateform after 2015. The current usage metrics is available 48-96 hours after online publication and is updated daily on week days.
Initial download of the metrics may take a while.