Fig. 19
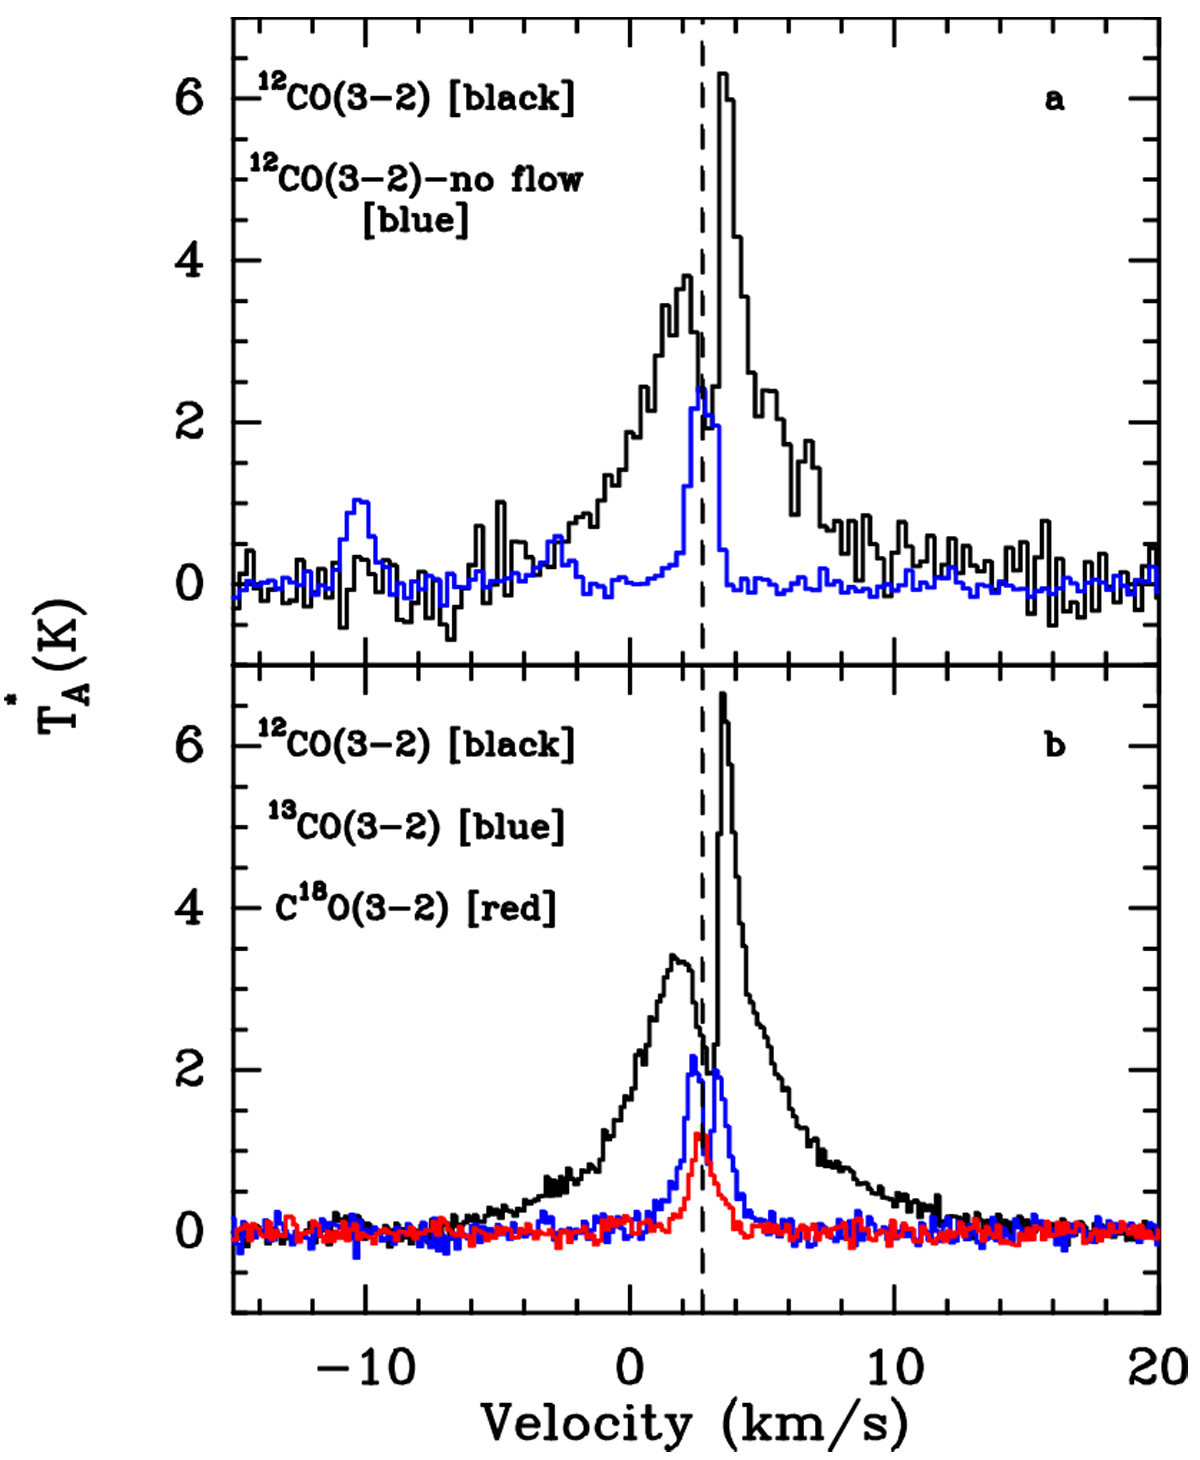
JCMT data. Comparison of spectra at the location of the YSO (coinciding with the centre of the outflow and the sub-mm continuum peak). Panel a: 12CO(3–2) spectrum (broad emission line; taken from the mapping data). The weaker, narrow blue line is the average of 45 spectra in the 12CO(3–2)-map, with α > 25′′, well away from the outflow and hence representing the quiescent gas. The dashed line indicates its central velocity (2.75 km s−1), which corresponds with that of the dip in the line profile at the centre of the outflow, while the width of the dip is virtually identical to the fwhm of the quiescent gas profile. Panel b: deep J=3–2 spectra of three CO-isotopologues. Only C18O (red) does not show a self-absorption dip. The velocity of its peak nearly coincides with the central velocity of the quiescent gas in panel a.
Current usage metrics show cumulative count of Article Views (full-text article views including HTML views, PDF and ePub downloads, according to the available data) and Abstracts Views on Vision4Press platform.
Data correspond to usage on the plateform after 2015. The current usage metrics is available 48-96 hours after online publication and is updated daily on week days.
Initial download of the metrics may take a while.