Fig. 16
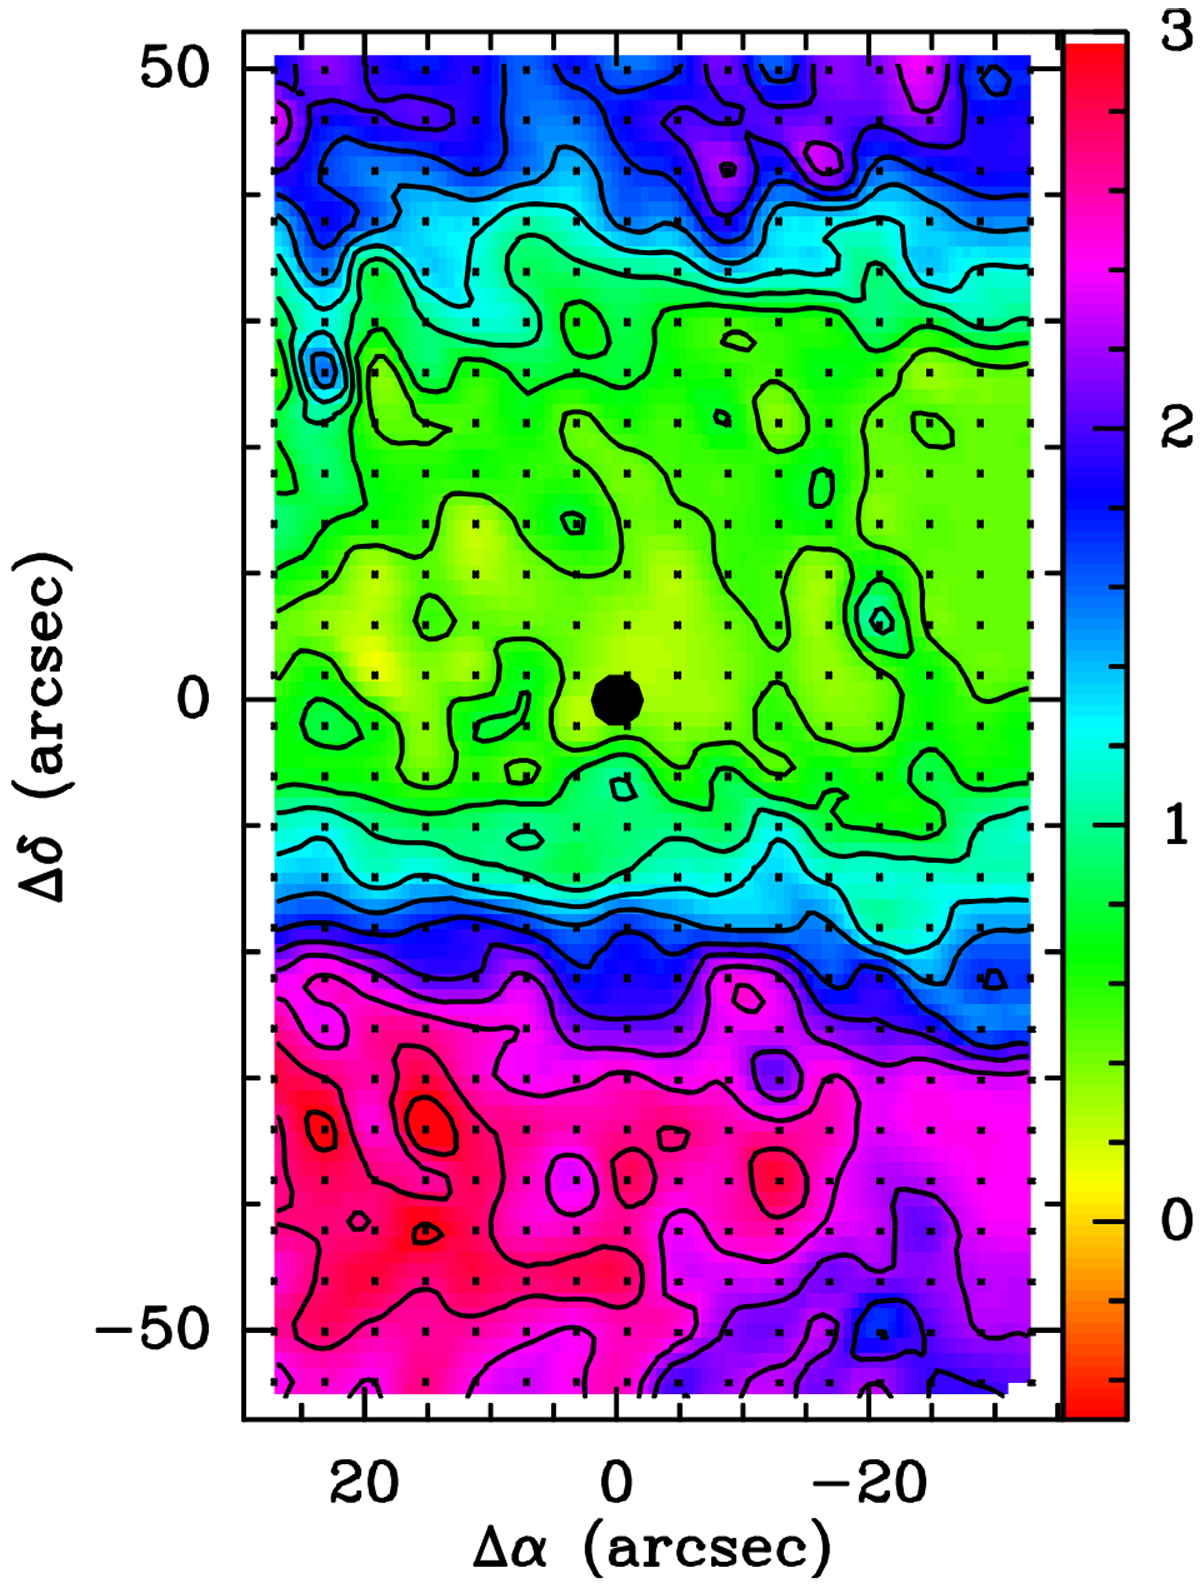
IRAM data. Distribution of ![]() of the − 10 km s−1 component. Contours (lowest(step)highest) are 0.5(0.25)3.0 K. It peaks towards the SE of the map, and is unrelated to the molecular gas in the globule, which is at Vlsr ~ 2.8 km s−1. The black dot indicates the position of the sub-mm peak, see Figs. 2, 3). Offsets are relative to the 2MASS YSO position (see Table 1). The YSO is located in the layer of least-intense emission of this component.
of the − 10 km s−1 component. Contours (lowest(step)highest) are 0.5(0.25)3.0 K. It peaks towards the SE of the map, and is unrelated to the molecular gas in the globule, which is at Vlsr ~ 2.8 km s−1. The black dot indicates the position of the sub-mm peak, see Figs. 2, 3). Offsets are relative to the 2MASS YSO position (see Table 1). The YSO is located in the layer of least-intense emission of this component.
Current usage metrics show cumulative count of Article Views (full-text article views including HTML views, PDF and ePub downloads, according to the available data) and Abstracts Views on Vision4Press platform.
Data correspond to usage on the plateform after 2015. The current usage metrics is available 48-96 hours after online publication and is updated daily on week days.
Initial download of the metrics may take a while.