Fig. 14
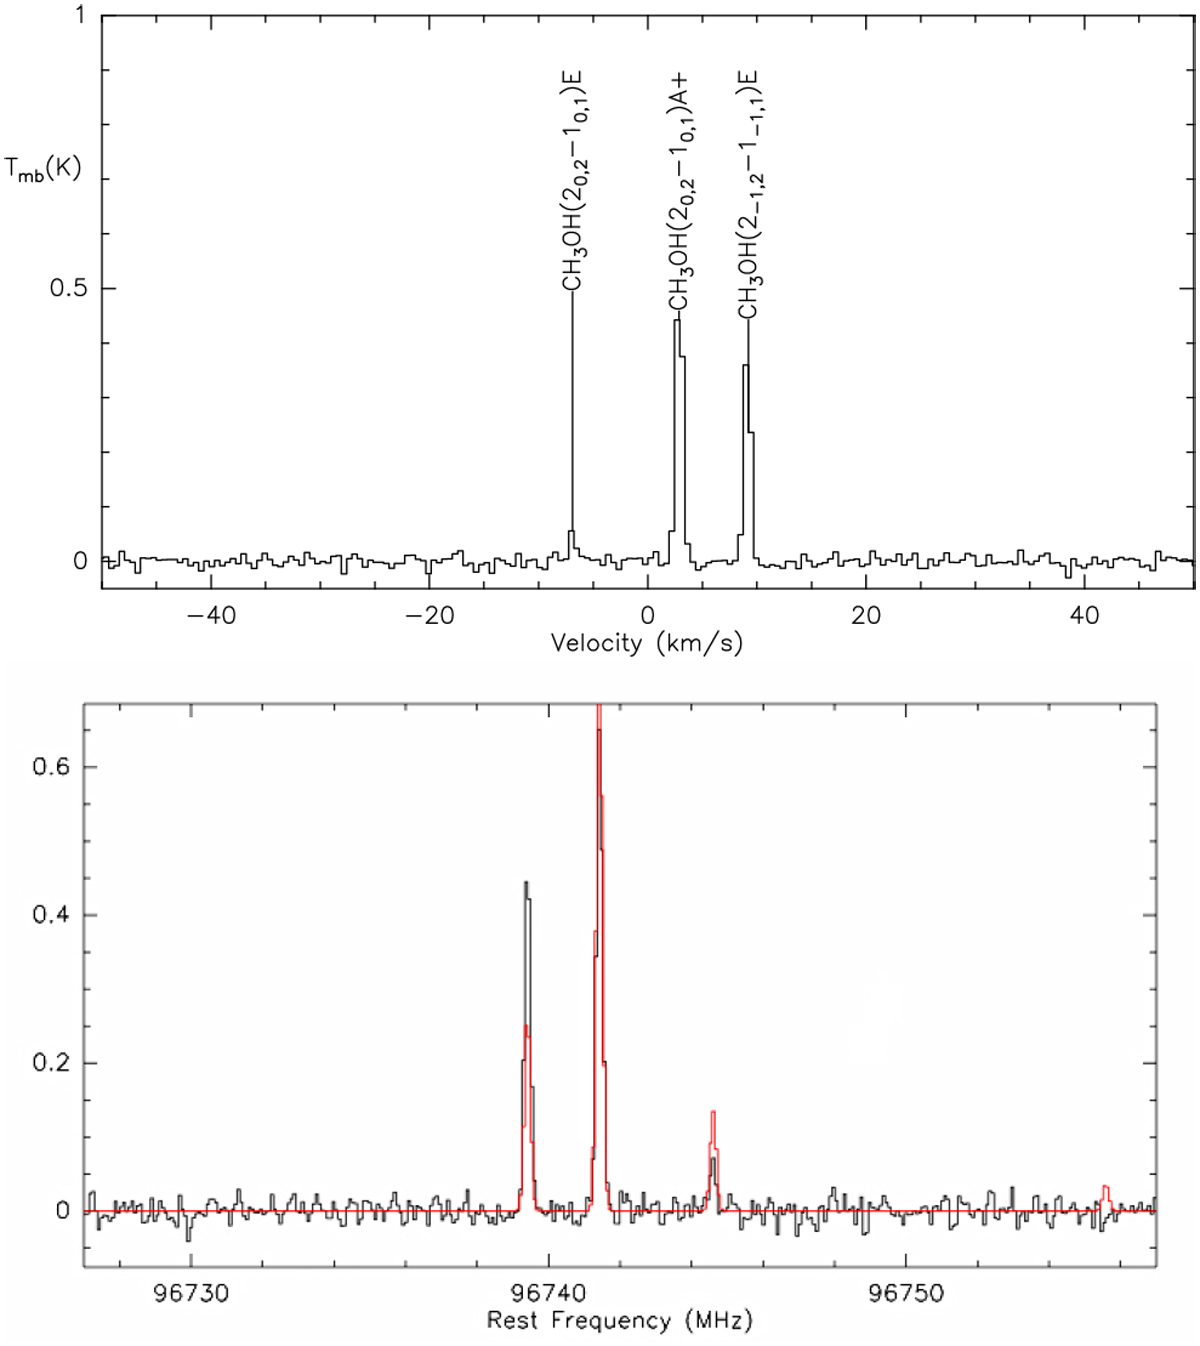
IRAM 30-m data. Top panel: average CH3OH(2 − 1) spectrum of observations at 6 positions in which the three indicated lines are detected. The spectrum has been smoothed to a resolution of 0.484 km s−1; rms = 0.014 K. Bottom panel: fit (in red) to the same average spectrum (at original resolution of 0.242 km s−1, and shown in frequency scale). See text for details.
Current usage metrics show cumulative count of Article Views (full-text article views including HTML views, PDF and ePub downloads, according to the available data) and Abstracts Views on Vision4Press platform.
Data correspond to usage on the plateform after 2015. The current usage metrics is available 48-96 hours after online publication and is updated daily on week days.
Initial download of the metrics may take a while.