Fig. 13
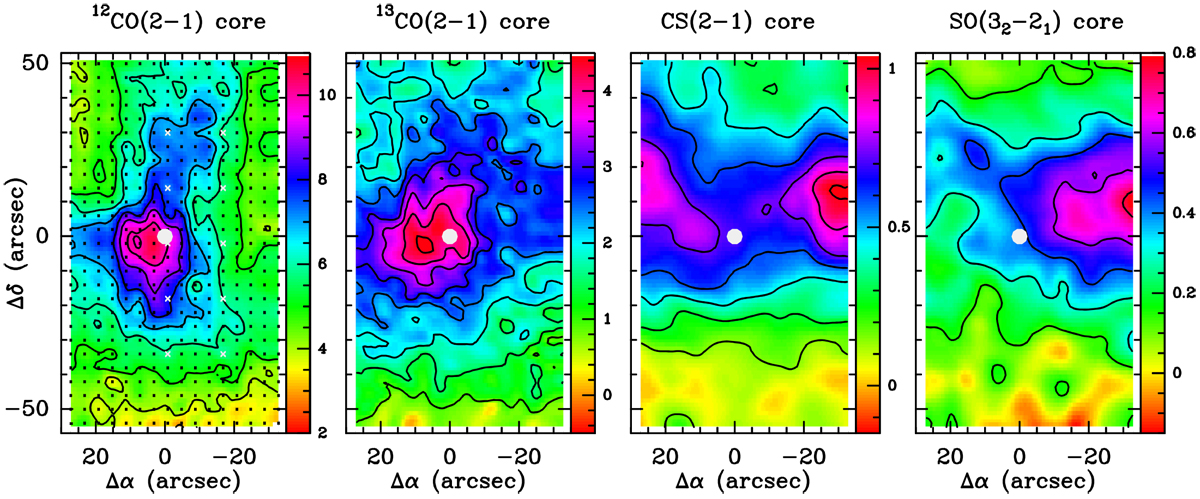
IRAM data. 12CO, 13CO, CS, and SO ![]() , integrated between 1.5 and 3.9 km s−1 (avoiding the line wings caused by outflow). From left to right: contours low(step)max: 3(1)11 K km s−1 (12CO); 1(0.5)4.5 K km s−1 (13CO); 0.15(0.15)1.05 K km s−1 (CS); and 0.15(0.15)0.80 K km s−1 (SO). The white dot indicates the location of the 850 μm peak. The white crosses in the leftmost panel indicate the positions where CH3 OH was observed. All offsets are relative to the 2MASS YSO position (see Table 1).
, integrated between 1.5 and 3.9 km s−1 (avoiding the line wings caused by outflow). From left to right: contours low(step)max: 3(1)11 K km s−1 (12CO); 1(0.5)4.5 K km s−1 (13CO); 0.15(0.15)1.05 K km s−1 (CS); and 0.15(0.15)0.80 K km s−1 (SO). The white dot indicates the location of the 850 μm peak. The white crosses in the leftmost panel indicate the positions where CH3 OH was observed. All offsets are relative to the 2MASS YSO position (see Table 1).
Current usage metrics show cumulative count of Article Views (full-text article views including HTML views, PDF and ePub downloads, according to the available data) and Abstracts Views on Vision4Press platform.
Data correspond to usage on the plateform after 2015. The current usage metrics is available 48-96 hours after online publication and is updated daily on week days.
Initial download of the metrics may take a while.