Fig. 12
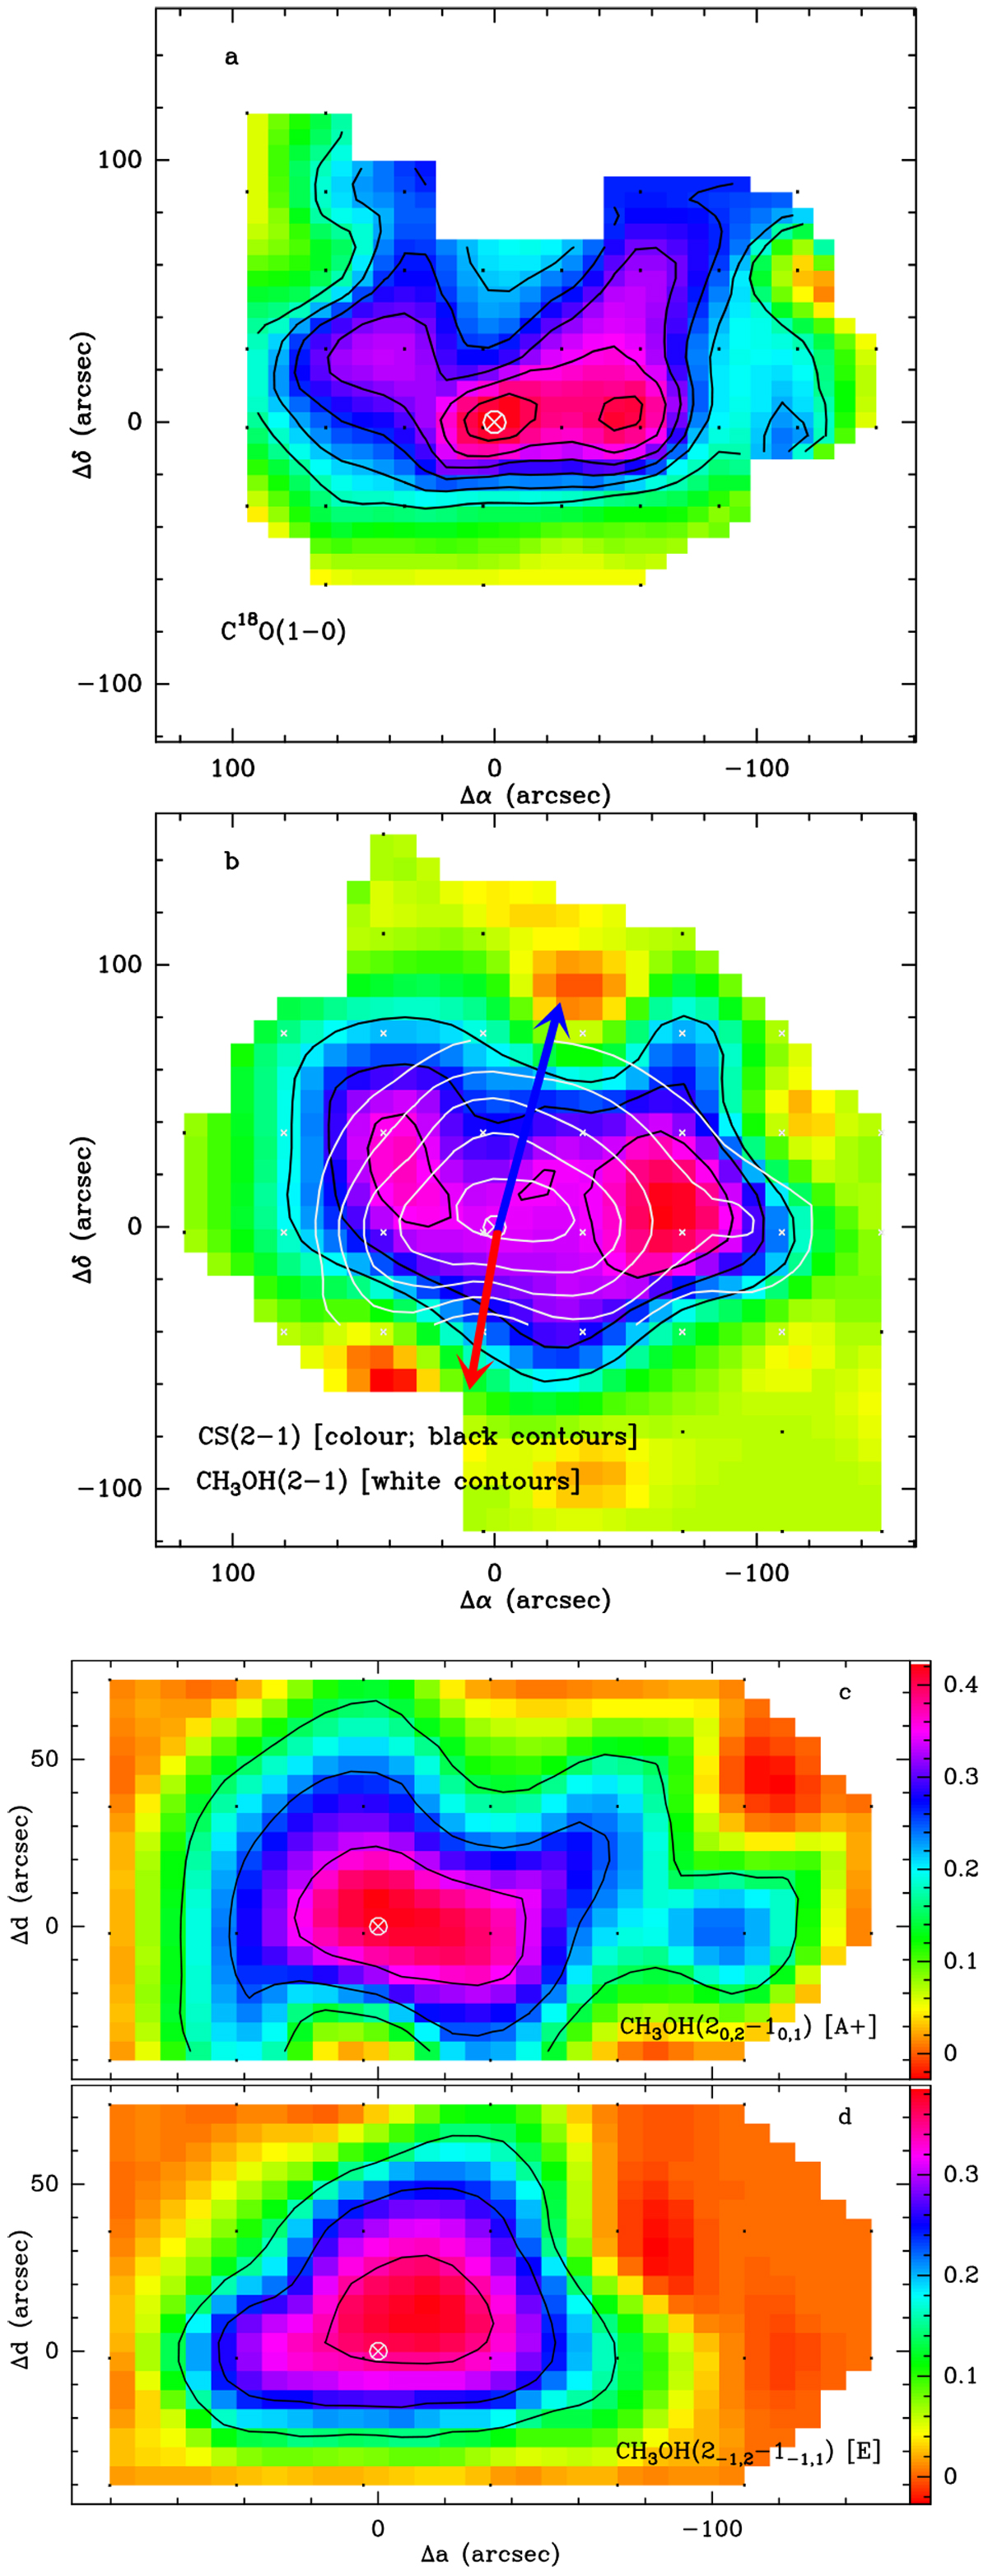
Onsala data. Panel a: C18O(1–0) ∫Tmbdv. Lowest contour and step: 0.6 and 0.2 K km s−1; panel b: CS(2–1) ∫Tmbdv (colour scale and black contours; lowest contour and step: 0.35, 0.2 K km s−1) with CH3OH(2–1) ∫Tmbdv (white contours; lowest contour and step: 0.15 K km s−1) superimposed; the combined area under the two emission lines with the lowest upper level temperature (E and A+; Table 4 and Fig. 14) are shown. The red and blue arrows indicate the approximate direction of the outflow detected in CO(3–2) (see text). The small white crosses indicate the positions where both CS and CH3 OH were observed; the black dots are for CS only. Panel c: CH3OH(2–1) ∫Tmbdv for the A+ component (see Fig 14) only. Lowest contour and step: 0.15, 0.1 K km s−1. Panel d: as c, but for the E-component only. In all panels, the white crossed circle indicates the position of the 850 μm peak, which is also that of the embedded YSO. All offsets are relative to the 2MASS YSO position (see Table 1).
Current usage metrics show cumulative count of Article Views (full-text article views including HTML views, PDF and ePub downloads, according to the available data) and Abstracts Views on Vision4Press platform.
Data correspond to usage on the plateform after 2015. The current usage metrics is available 48-96 hours after online publication and is updated daily on week days.
Initial download of the metrics may take a while.