Fig. 2
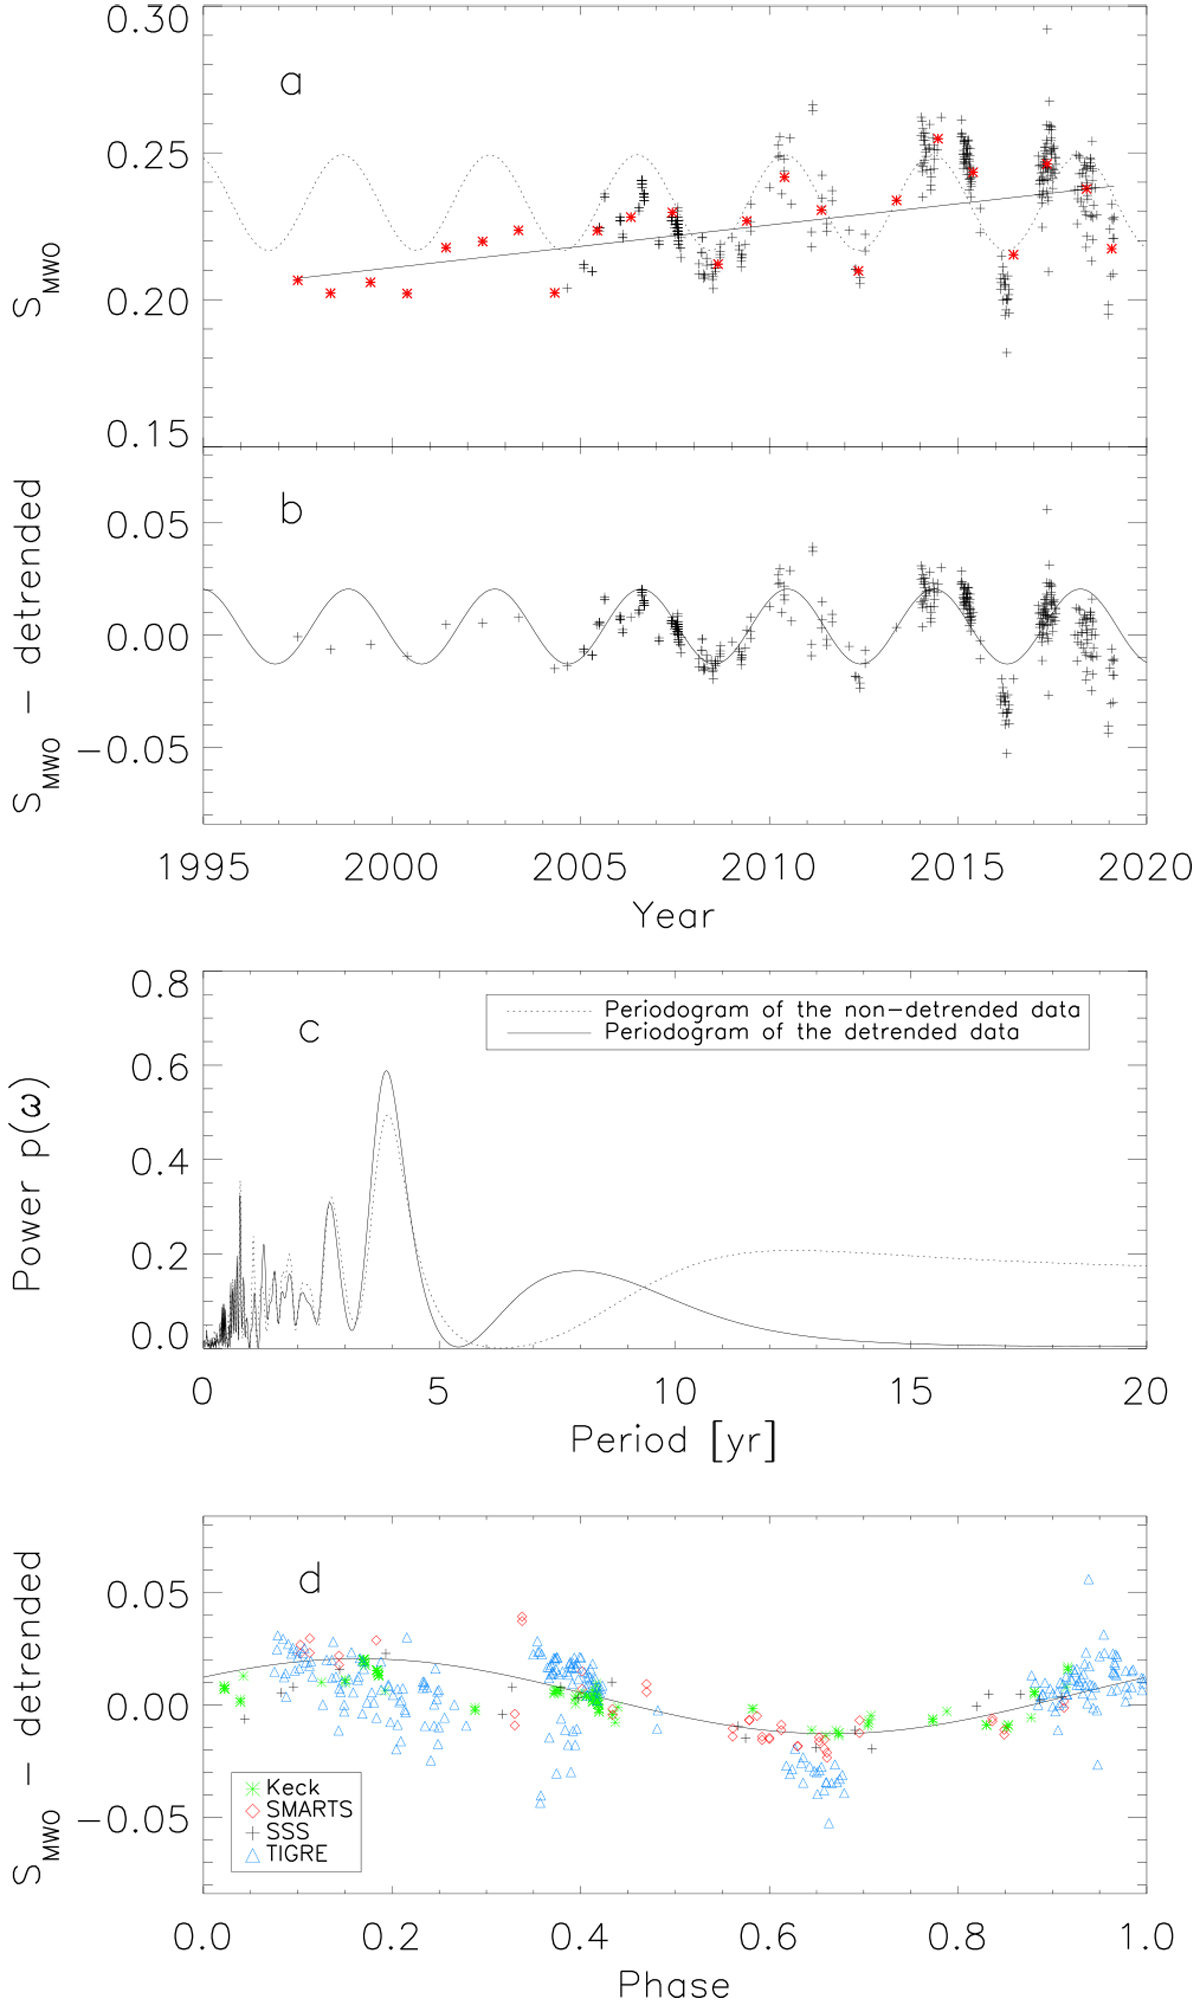
Panel a: combined SMWO time series is displayed with black crosses. The red asterisks show the seasonal data from SSS and TIGRE data and the solid line the result of the linear trend fit. The dotted line depicts the sinusoidal fit of the Lomb-Scargle analysis of the non-detrended data with a period of 3.91 yrs. Panel b: detrended SMWO time series. The solid line represents the sinusoidal fit with the period of 3.88 yr found in the GLS analysis. Panel c: periodograms of GLS (generalised Lomb-Scargle) analysisof detrended and non-detrended data. Panel d: phase-folded detrended SMWO time series shown with sinusoidal fit. Here, the SMWO of the individual time series are colour-coded and labelled (Keck: green asterisks, SMARTS: red diamonds, SSS: black crosses, and TIGRE: blue triangles).
Current usage metrics show cumulative count of Article Views (full-text article views including HTML views, PDF and ePub downloads, according to the available data) and Abstracts Views on Vision4Press platform.
Data correspond to usage on the plateform after 2015. The current usage metrics is available 48-96 hours after online publication and is updated daily on week days.
Initial download of the metrics may take a while.