Open Access
Fig. 6.
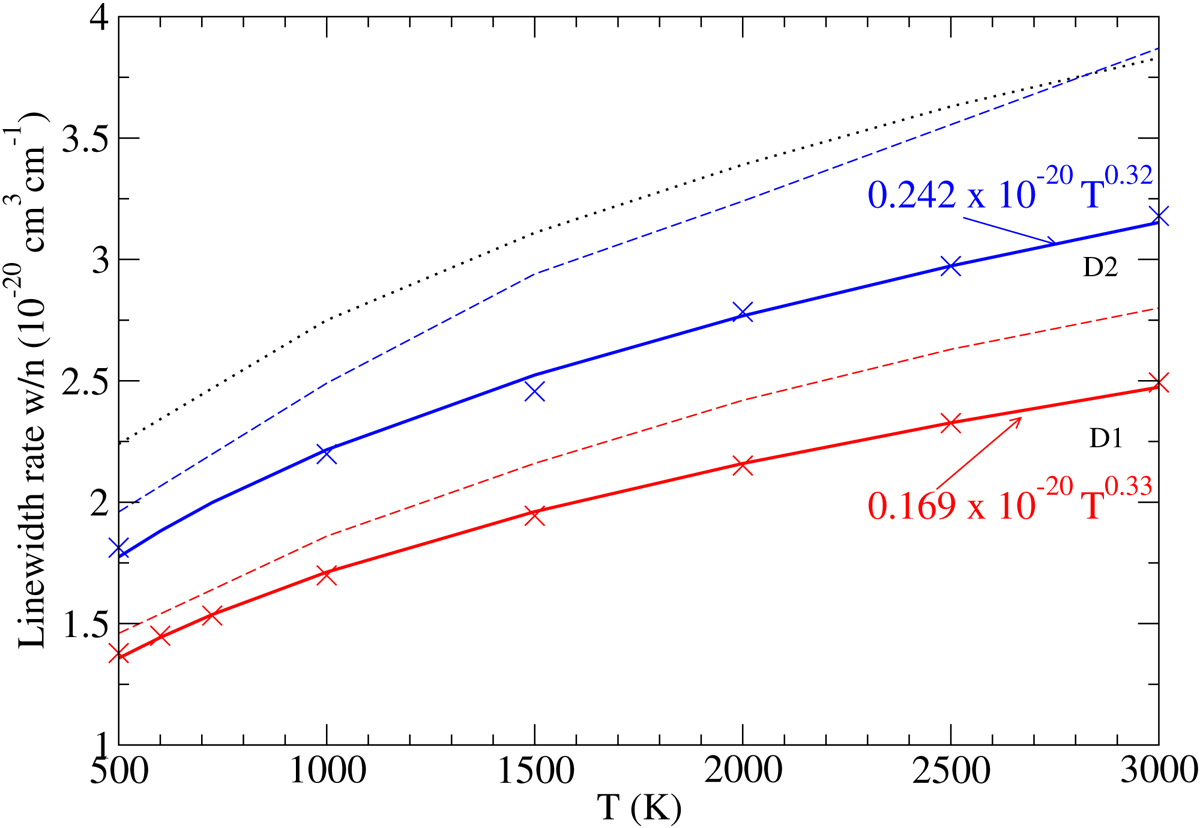
Variation with temperature of the half-width of the D2 (blue curves) and D1 (red curves) lines of Na I perturbed by H2 collisions. New ab initio potentials (full line), pseudo-potentials of Rossi & Pascale (1985) (dashed lines), and the van der Waals potential (black dotted lines).
Current usage metrics show cumulative count of Article Views (full-text article views including HTML views, PDF and ePub downloads, according to the available data) and Abstracts Views on Vision4Press platform.
Data correspond to usage on the plateform after 2015. The current usage metrics is available 48-96 hours after online publication and is updated daily on week days.
Initial download of the metrics may take a while.