Fig. 14
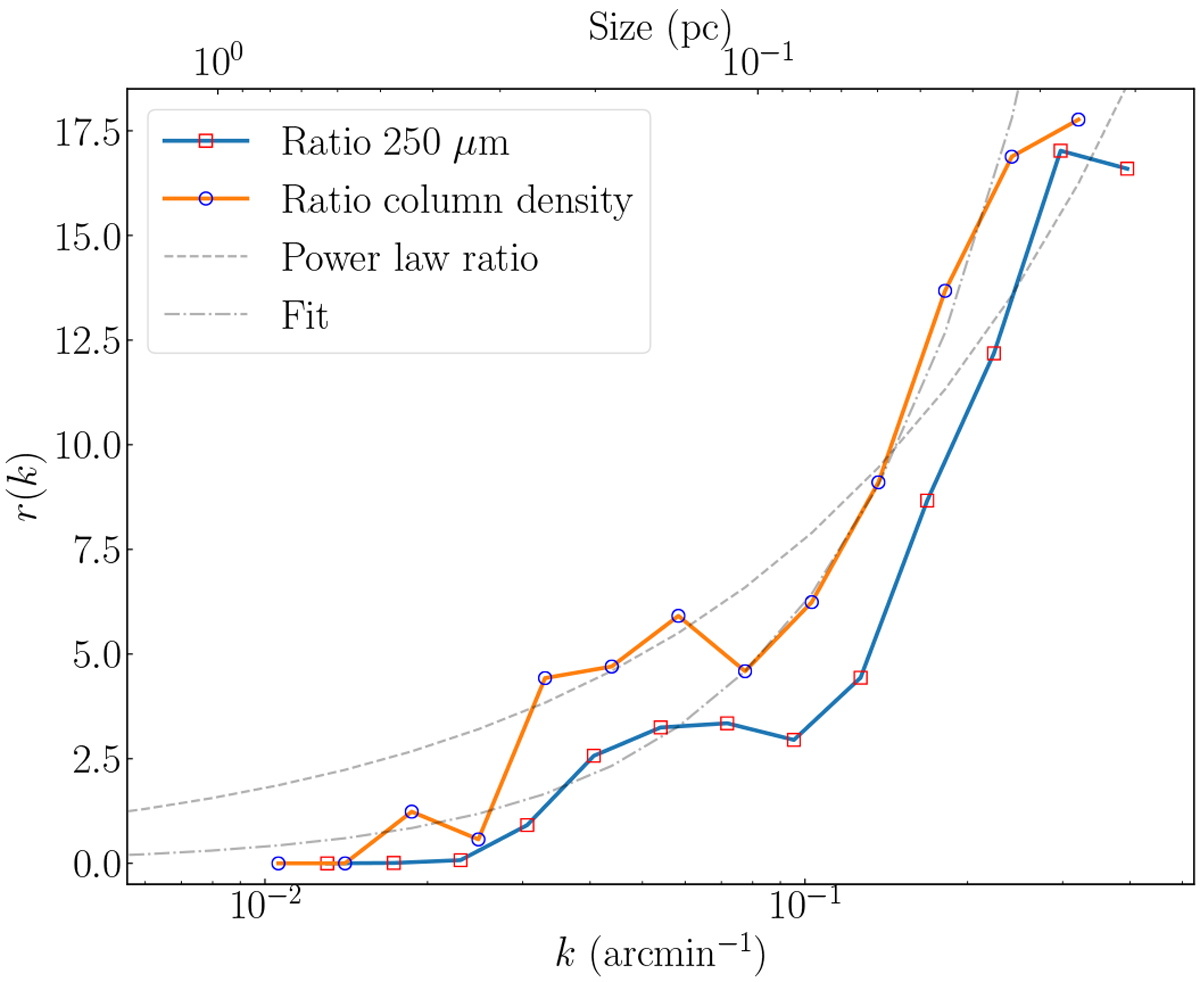
Ratio of the coherent to the Gaussian power spectra for the column density and the 250 μm maps. The dashed curve shows the exponential curve defined in Eq. 27 using the fitted power-law values for the column density map in Table 2. The dot-dashed curve shows the exponential for the power spectra ratio fitted for 0.08 ≲ k ≲ 0.2 arcmin−1, which corresponds to 0.03 ≲ l ≲ 0.1 pc.
Current usage metrics show cumulative count of Article Views (full-text article views including HTML views, PDF and ePub downloads, according to the available data) and Abstracts Views on Vision4Press platform.
Data correspond to usage on the plateform after 2015. The current usage metrics is available 48-96 hours after online publication and is updated daily on week days.
Initial download of the metrics may take a while.