Fig. 9.
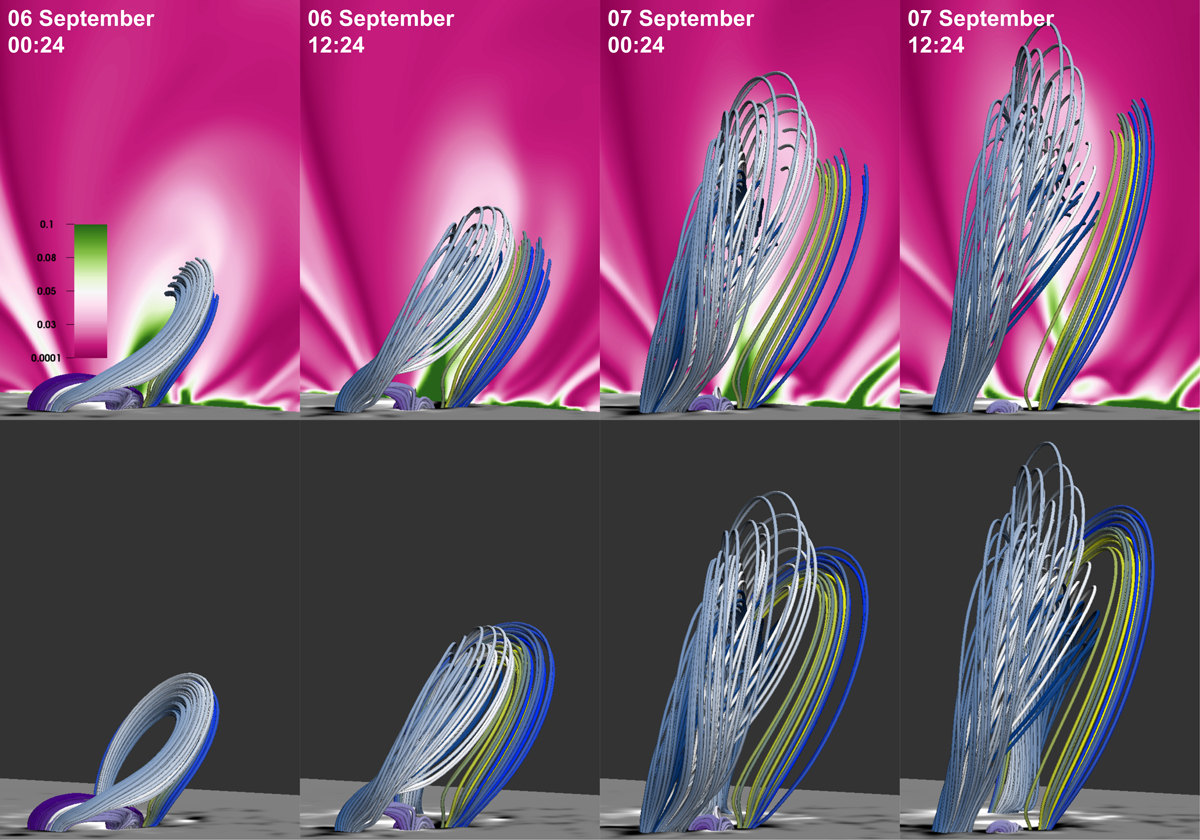
Simulation excerpts from 6 September 00:24 to 7 September 12:24 UT with a spacing of 12 h between each image. In the top row the flux rope associated with the X9.3 flare is bisected by a plane of the current density (pink to green), while the bottom row has this removed to provide an unobstructed view. The field lines are coloured as in Fig. 8, serving only to distinguish the bundles of lines and the different lines within each bundle. The flux rope reaches a peak height of approximately 150 Mm.
Current usage metrics show cumulative count of Article Views (full-text article views including HTML views, PDF and ePub downloads, according to the available data) and Abstracts Views on Vision4Press platform.
Data correspond to usage on the plateform after 2015. The current usage metrics is available 48-96 hours after online publication and is updated daily on week days.
Initial download of the metrics may take a while.