Fig. 8.
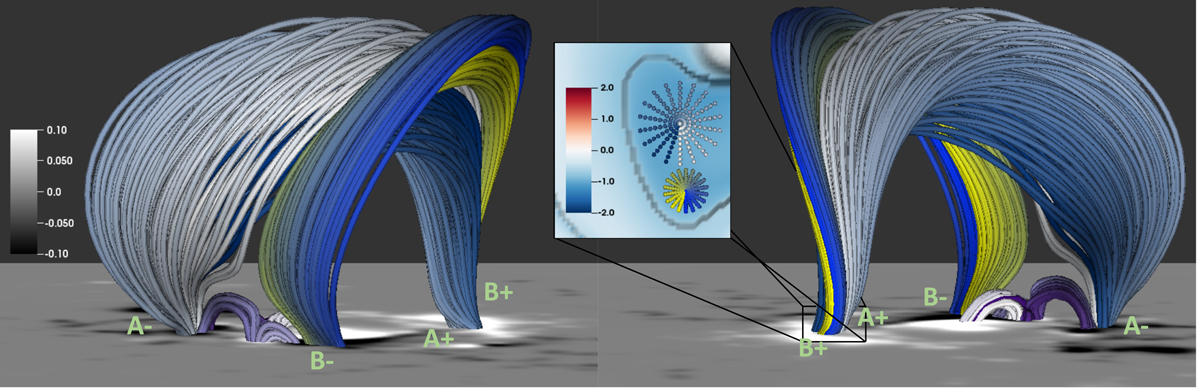
Two snapshots from 6 September 12:24 UT from different viewing angles where the photosphere is represented by the simulated Bz magnetogram (white to black) with a colour bar in Tesla. Plotted are three sets of field lines: the white to blue lines which connect from A+ to A−, the yellow to blue lines which connect from B+ to B−, and the white to purple lines illustrating a null point between A− and B−. Also shown in the inset is an excerpt of a photospheric map of the twist Tw, with a colour bar from negative (blue) to positive (red), illustrating the seed points of the field lines from A+ and B+. A grey to black line is superposed onto the twist map illustrating the base 10 logarithmic squashing factor Q from 3 to 4. The structures reach a peak height of approximately 82 Mm.
Current usage metrics show cumulative count of Article Views (full-text article views including HTML views, PDF and ePub downloads, according to the available data) and Abstracts Views on Vision4Press platform.
Data correspond to usage on the plateform after 2015. The current usage metrics is available 48-96 hours after online publication and is updated daily on week days.
Initial download of the metrics may take a while.