Fig. 6.
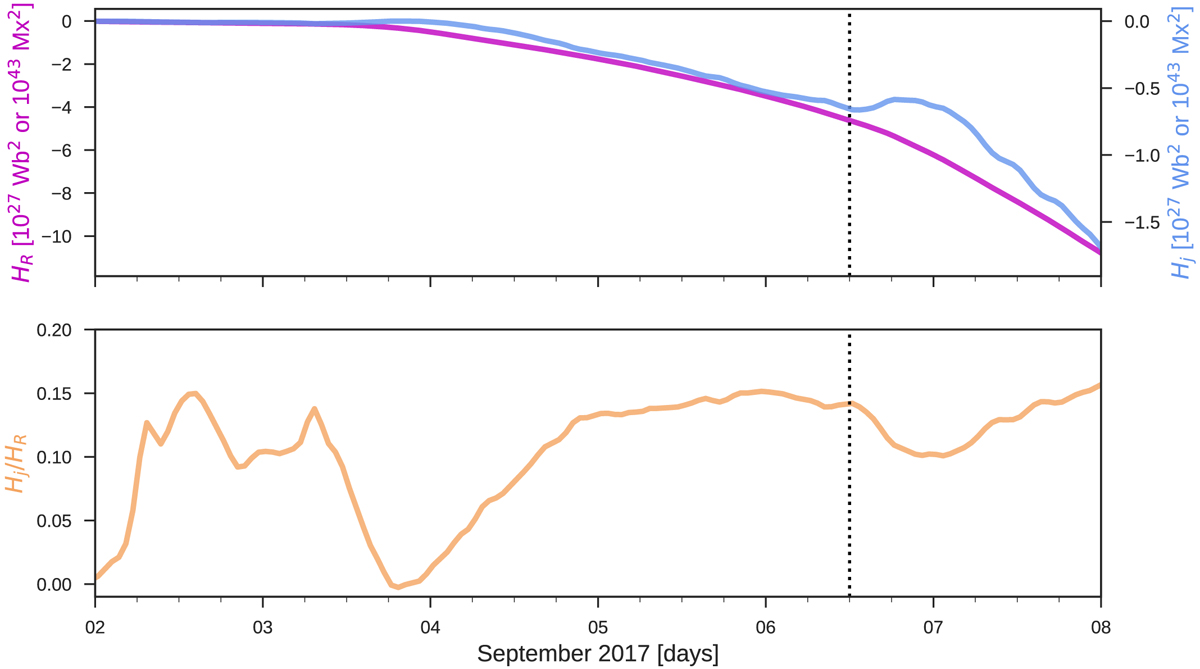
Temporal evolution of helicity. Top panel: relative helicity (purple) compared to the helicity of the current-carrying magnetic field (blue) on different scales. Bottom panel: ratio of the current-carrying helicity to the relative helicity (orange). The dashed vertical line in each panel indicates the time of the X9.3 flare.
Current usage metrics show cumulative count of Article Views (full-text article views including HTML views, PDF and ePub downloads, according to the available data) and Abstracts Views on Vision4Press platform.
Data correspond to usage on the plateform after 2015. The current usage metrics is available 48-96 hours after online publication and is updated daily on week days.
Initial download of the metrics may take a while.