Fig. 5.
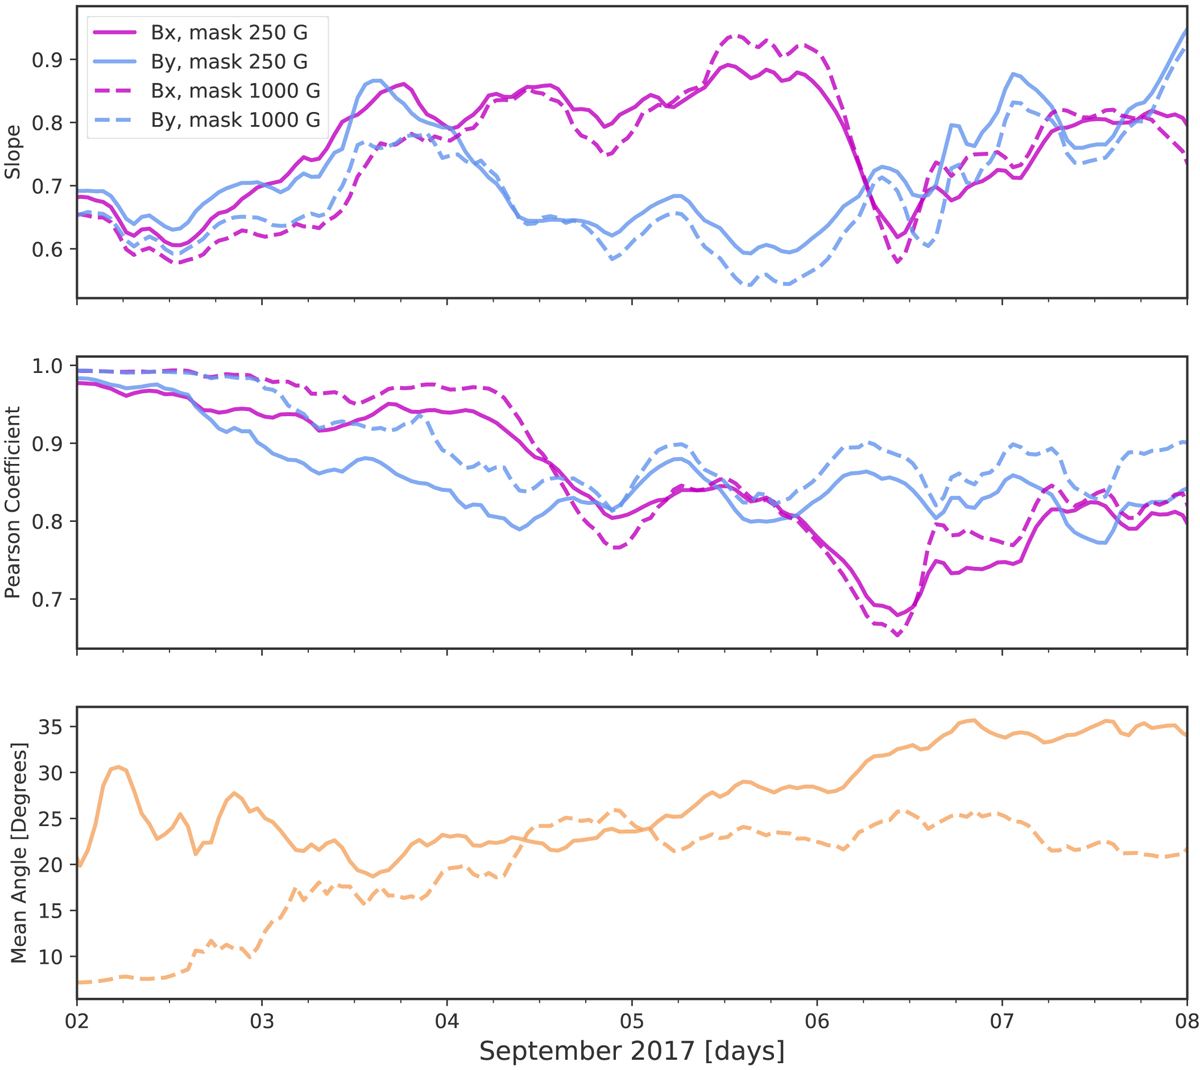
Temporal evolution of metrics comparing the horizontal magnetic field of the observed input magnetograms vs. the simulated output magnetograms. Top and middle panels: slope and Pearson coefficient respectively, for Bx (purple) and By (blue). Bottom panel: mean angle between the input and output fields (orange). The solid lines use a mask of 250 G, while the dashed lines use a mask of 1000 G on the magnitude of the magnetic field vector.
Current usage metrics show cumulative count of Article Views (full-text article views including HTML views, PDF and ePub downloads, according to the available data) and Abstracts Views on Vision4Press platform.
Data correspond to usage on the plateform after 2015. The current usage metrics is available 48-96 hours after online publication and is updated daily on week days.
Initial download of the metrics may take a while.