Fig. 10.
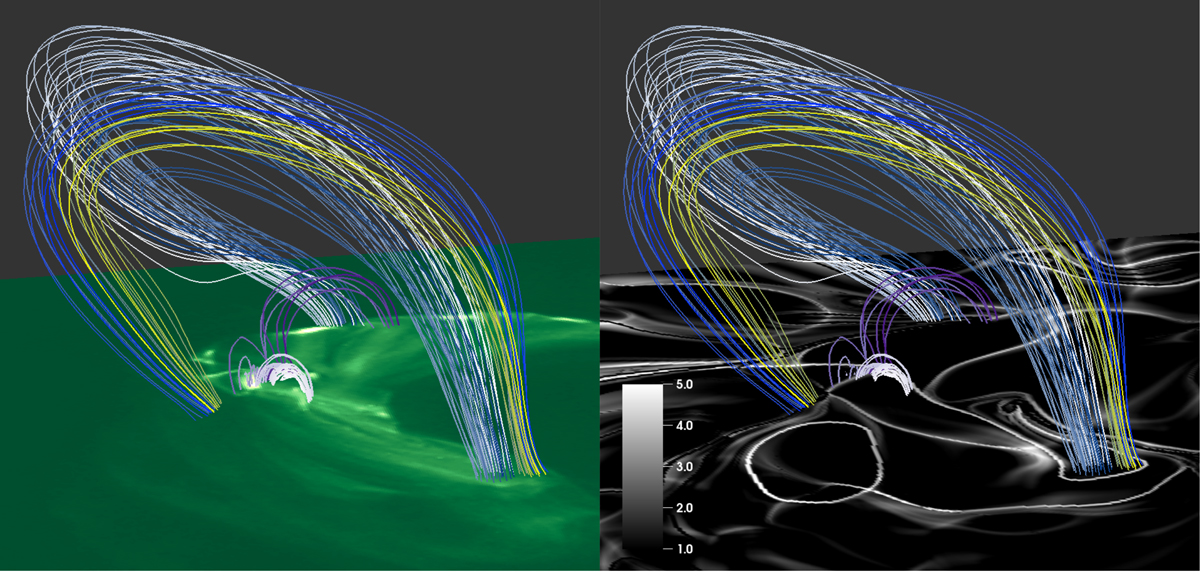
Comparing an observation with the AIA 94 Å filter (left) and a photospheric map of the squashing factor Q from our simulations (right). The Q map is from 06 September 09:24 UT, while the time of the AIA observation was 06 September 08:59 UT because the observations were saturated closer to 09:24 UT due to the onset of the X2.2 flare at 08:57 UT. Also shown are the key field lines, consistent with Fig. 8 with minor footpoint adjustments due to time. The field lines are from 06 September 09:24 in both panels.
Current usage metrics show cumulative count of Article Views (full-text article views including HTML views, PDF and ePub downloads, according to the available data) and Abstracts Views on Vision4Press platform.
Data correspond to usage on the plateform after 2015. The current usage metrics is available 48-96 hours after online publication and is updated daily on week days.
Initial download of the metrics may take a while.