Fig. 8
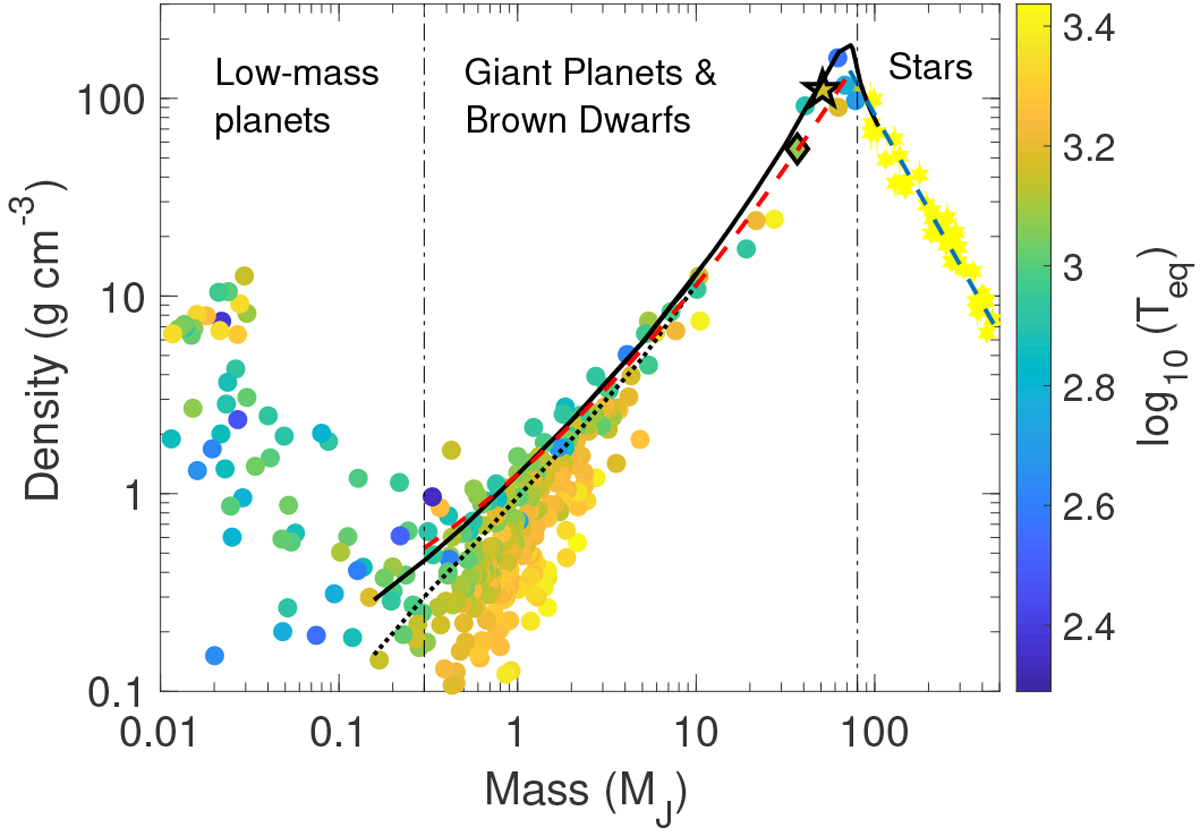
Mass-density diagram for planets, brown dwarfs, and low-mass stars in eclipsing binaries with a precision in measured mass and density better than 20%. The star and diamond symbols mark the locations of EPIC 212036875 b and EPIC 219388192b also found by our programme (Nowak et al. 2017). The red dashed line represents a second-order polynomial fit to the data with M = 0.3–80 MJ and equilibrium temperatures <1000 K. The blue dashed line shows a linear fit to the stars with M > 80 MJ. The nominalseparation at 80 MJ between brown dwarfs and stars, and the empirical separation between low-mass and giant planets at 0.3 MJ are marked with the vertical dash-dotted lines. The solid black line shows the theoretical relationship for H/He dominated giant objectswith Z = 0.02, age = 5 Gyr, without irradiation (Baraffe et al. 2003, 2008), and the dotted black line the same model including irradiation from a solar-type star at 0.045 AU (Baraffe et al. 2008).
Current usage metrics show cumulative count of Article Views (full-text article views including HTML views, PDF and ePub downloads, according to the available data) and Abstracts Views on Vision4Press platform.
Data correspond to usage on the plateform after 2015. The current usage metrics is available 48-96 hours after online publication and is updated daily on week days.
Initial download of the metrics may take a while.