Free Access
Fig. 1
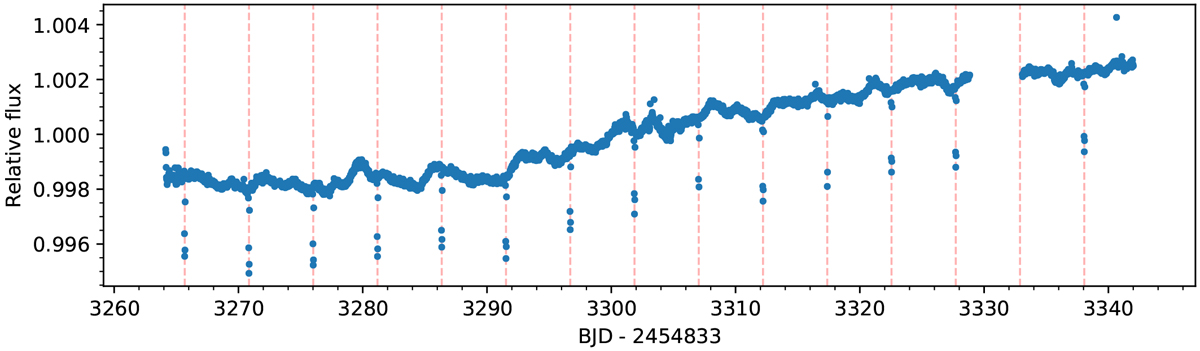
Pre-processed Vanderburg K2 light curve of EPIC 212036875. The dashed vertical lines mark the 14 narrow and shallow brown dwarf transits used in the analysis. We also mark a missing transit located in a gap of the light curve. The broader periodic variation of approximately 0.07% is caused by stellar activity.
Current usage metrics show cumulative count of Article Views (full-text article views including HTML views, PDF and ePub downloads, according to the available data) and Abstracts Views on Vision4Press platform.
Data correspond to usage on the plateform after 2015. The current usage metrics is available 48-96 hours after online publication and is updated daily on week days.
Initial download of the metrics may take a while.