Fig. 3.
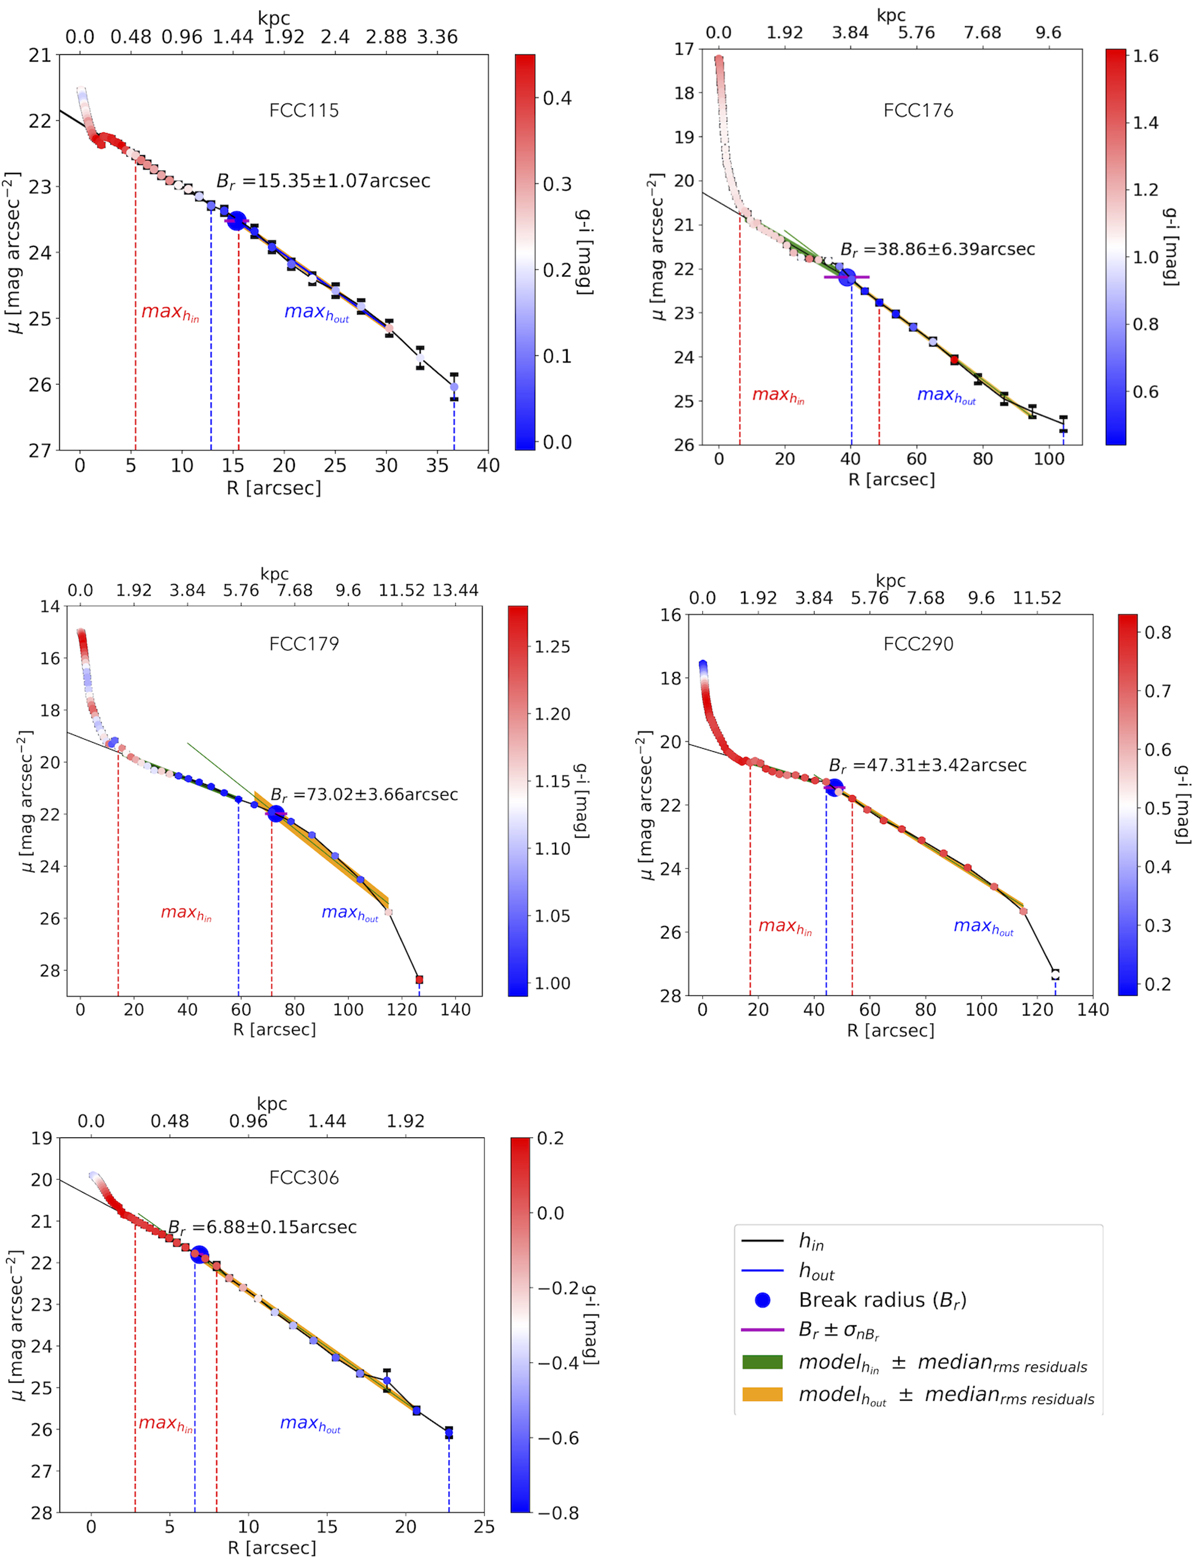
Surface brightness profiles of galaxies with Type II disc-break, with (g − i) colour as third parameter. In each plot, the break radius (Br) is marked at the intersecting point of the linear fits performed between hin and hout, with σnBr as the median of (n + 1)3 combinations of best fits on the inner and outer scale-lengths. The vertical dashed lines (maxhin and maxhout) indicate the regions for maxrangein = rangein ± n and maxrangeout = rangeout ± n where the algorithm produces (n + 1)2 linear least square fits. The shaded regions on hin and hout indicate the median of the rms of the residuals for (n + 1)2 linear least square fits.
Current usage metrics show cumulative count of Article Views (full-text article views including HTML views, PDF and ePub downloads, according to the available data) and Abstracts Views on Vision4Press platform.
Data correspond to usage on the plateform after 2015. The current usage metrics is available 48-96 hours after online publication and is updated daily on week days.
Initial download of the metrics may take a while.