Fig. C.2.
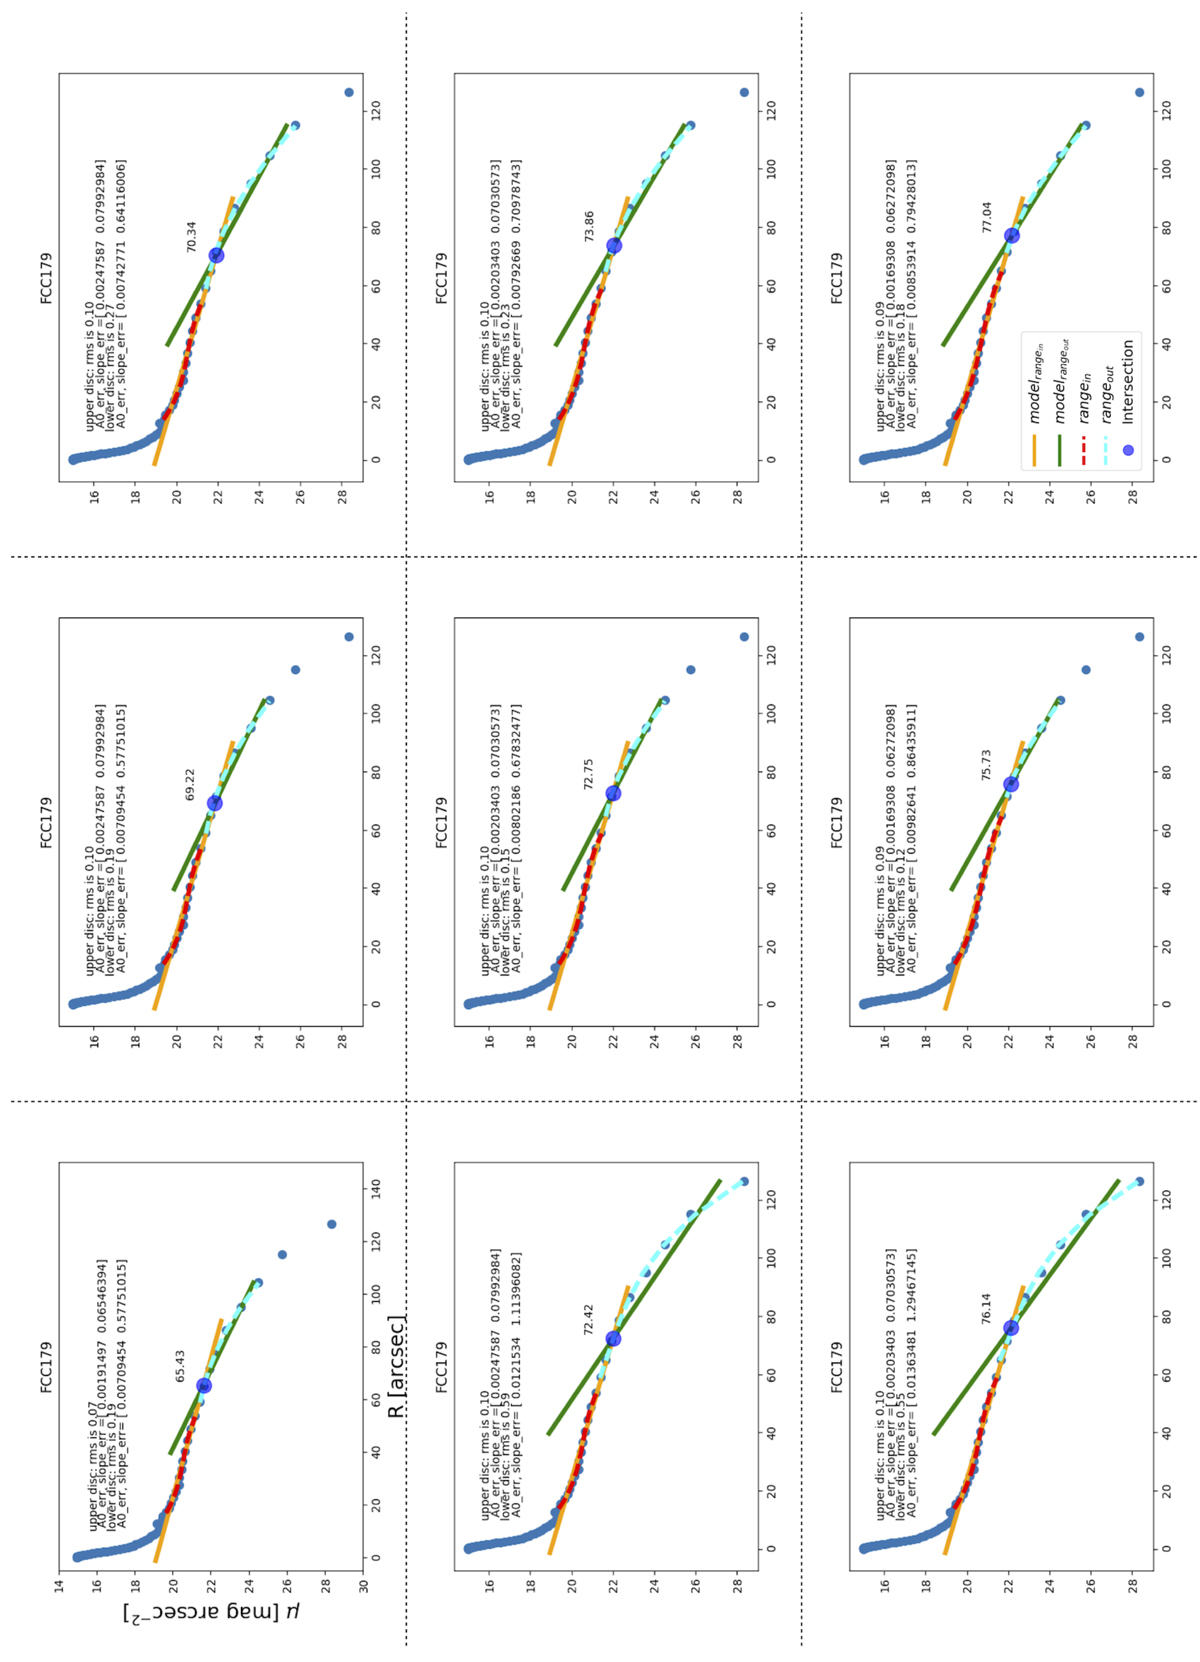
(n + 1)3 combinations of best fits on the inner and outer scale-lengths with minimal standard deviation, for FCC179 (here n = 2). rangein is represented with a red spline, and rangeout is represented with a cyan spline. modelrangein is marked in orange, while modelrangeout is marked in green. The break radius is marked at the intersecting point. Rms residuals, errors of the intercept, and slope of the fitted models for the inner and outer discs are mentioned in each plot.
Current usage metrics show cumulative count of Article Views (full-text article views including HTML views, PDF and ePub downloads, according to the available data) and Abstracts Views on Vision4Press platform.
Data correspond to usage on the plateform after 2015. The current usage metrics is available 48-96 hours after online publication and is updated daily on week days.
Initial download of the metrics may take a while.