Fig. 10.
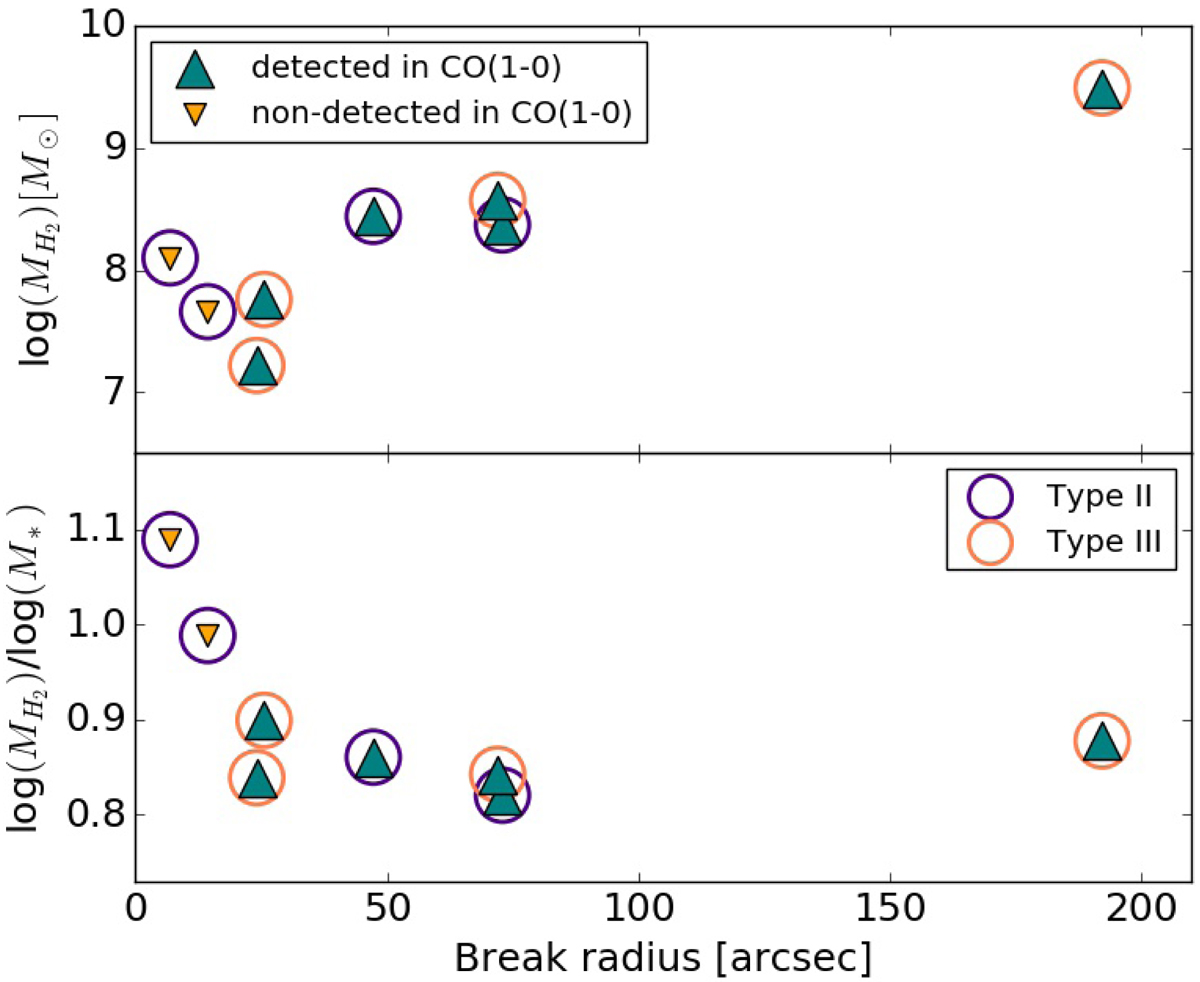
Molecular gas mass (top panel) and molecular gas-fractions (lower panel) as function of break radius. Green triangles represent galaxies detected in CO(1-0), and orange triangles represent galaxies non-detected in CO(1-0) for eight LTGs in our sample, which were surveyed by Zabel et al. (2019). Orange circles are galaxies with Type II profile, and purple circles are galaxies with Type III profile.
Current usage metrics show cumulative count of Article Views (full-text article views including HTML views, PDF and ePub downloads, according to the available data) and Abstracts Views on Vision4Press platform.
Data correspond to usage on the plateform after 2015. The current usage metrics is available 48-96 hours after online publication and is updated daily on week days.
Initial download of the metrics may take a while.