Fig. 1.
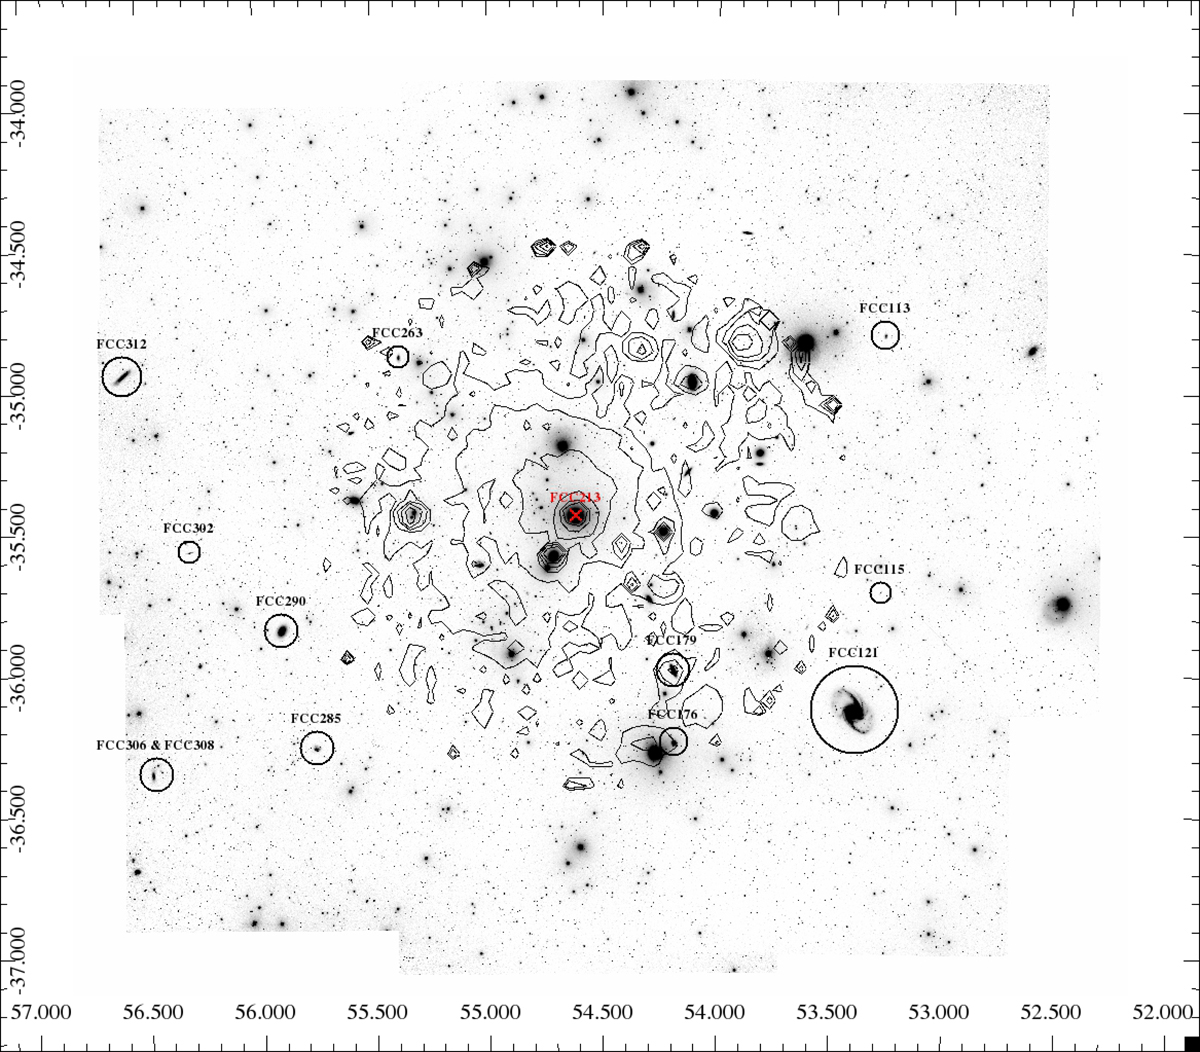
VST mosaic in g-band of Fornax cluster’s virial radius, at about 9 sq deg. The marked circles indicate the 12 LTGs presented in this work, with FCC267 located at the top north of the virial radius, outside this mosaic. Black contours are the X-Ray emission from ROSAT (Paolillo et al. 2002). The X-ray contours are spaced by a factor of 1.3, with the lowest level at 3.0 × 10⁻³ counts arcmin−2 s−1.
Current usage metrics show cumulative count of Article Views (full-text article views including HTML views, PDF and ePub downloads, according to the available data) and Abstracts Views on Vision4Press platform.
Data correspond to usage on the plateform after 2015. The current usage metrics is available 48-96 hours after online publication and is updated daily on week days.
Initial download of the metrics may take a while.