Fig. 8.
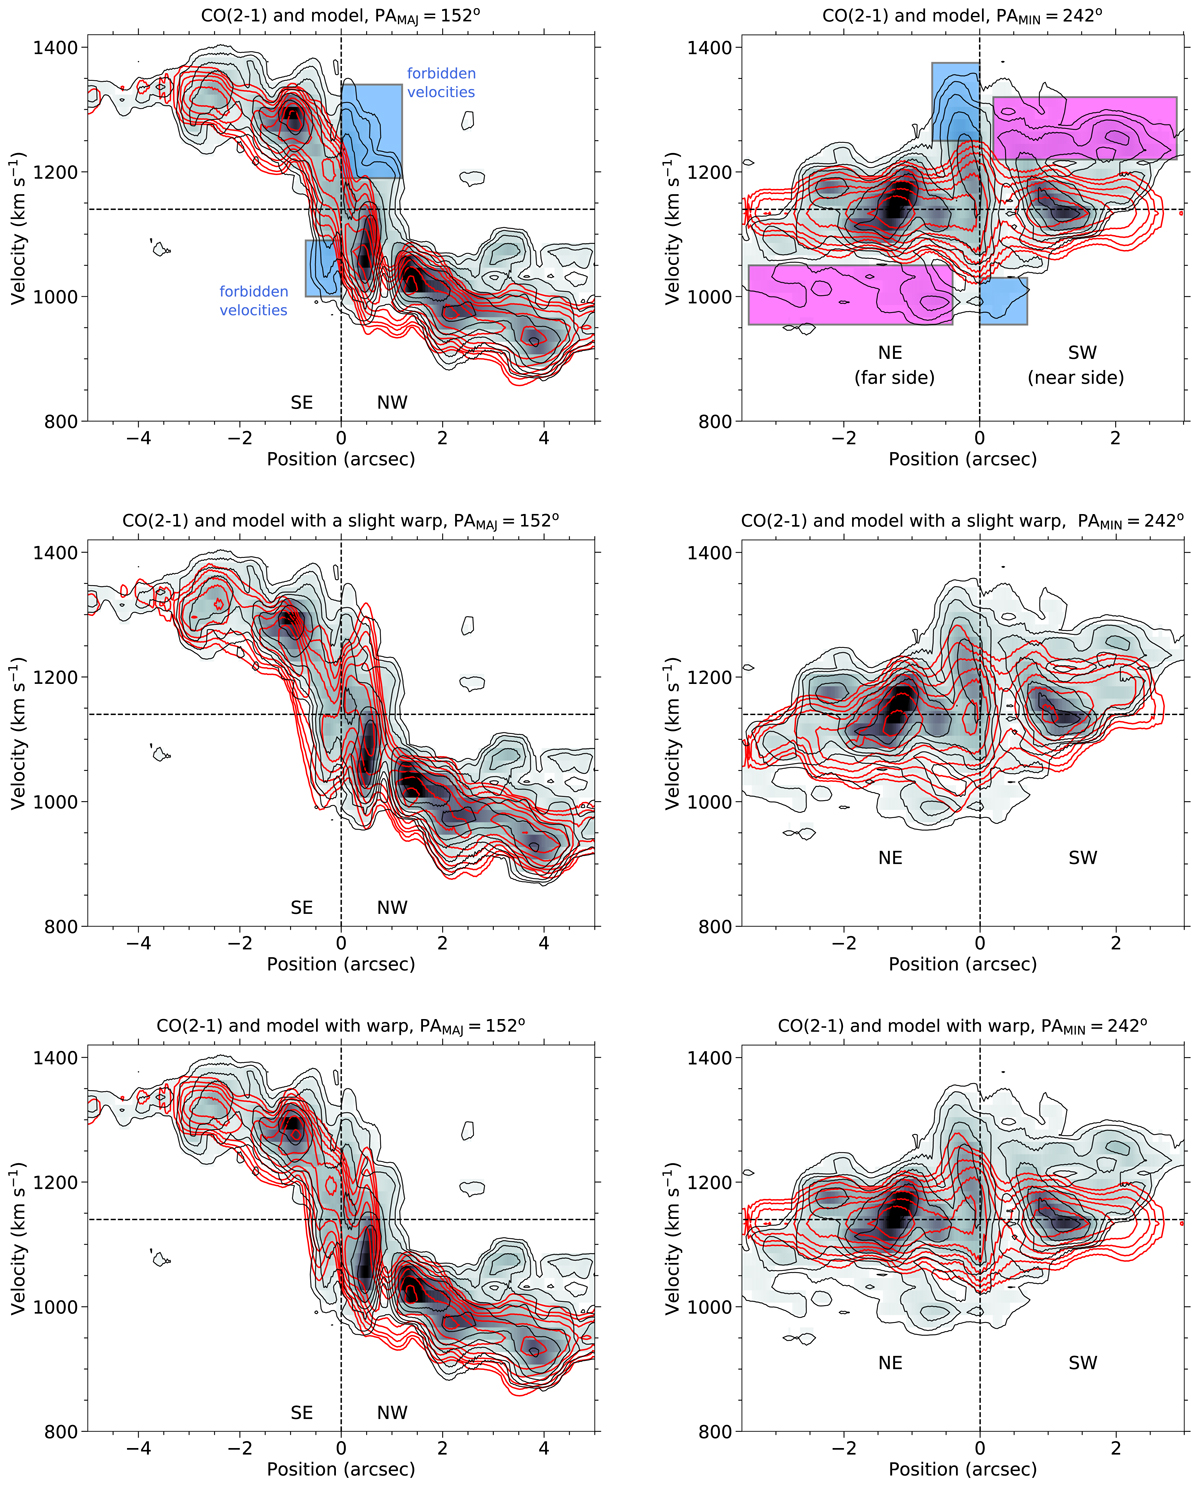
Grey-scale and black contours: observed CO(2–1) p − v diagrams along the kinematic major axis (left panels) and minor axis (right panels) of the host galaxy disk. We only show fluxes above 5σ. In all the panels the red contours represent the 3DBAROLO models as follows (see also Table 4): the first row is a rotating disk, the second row is a rotating disk with a slight nuclear warp, the third row is a rotating disk + a warp model consistent with the orientation of the ionization cone, the fourth row is a rotating disk with a nuclear radial component, and the fifth row is a rotating disk with a nuclear warp + radial component. The model contour levels are identical to the contour level of the observations. The vertical dotted black line marks the AGN position, and the horizontal dotted black line shows the derived systemic velocity. Top panels: we also highlight nuclear regions of forbidden velocities for a purely rotating disk. Along the minor axis the blue boxes indicate the nuclear outflow and the magenta ones regions with streaming motions due to the large-scale stellar bar.
Current usage metrics show cumulative count of Article Views (full-text article views including HTML views, PDF and ePub downloads, according to the available data) and Abstracts Views on Vision4Press platform.
Data correspond to usage on the plateform after 2015. The current usage metrics is available 48-96 hours after online publication and is updated daily on week days.
Initial download of the metrics may take a while.