Fig. 7.
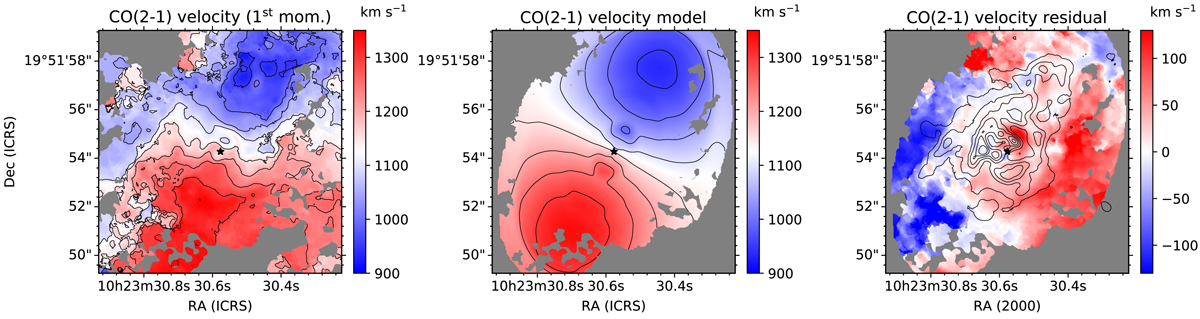
3DBAROLO maps of the observed CO(2–1) mean velocity field (first-order moment, left panel), the fitted model of a rotating disk with fixed PA, inclination (see Table 4 and text), systemic velocity, and kinematic center (middle panel), and the residual mean-velocity field (right panel). The FoV is 10″ × 10″, as in Fig. 1. The color bars indicate line-of-sight velocities in units of km s−1. The contours for the velocities in the left and middle panels are in steps of 50 km s−1. Right panel: the contours are the CO(2–1) intensity (zeroth-order moment map) on a linear scale.
Current usage metrics show cumulative count of Article Views (full-text article views including HTML views, PDF and ePub downloads, according to the available data) and Abstracts Views on Vision4Press platform.
Data correspond to usage on the plateform after 2015. The current usage metrics is available 48-96 hours after online publication and is updated daily on week days.
Initial download of the metrics may take a while.