Fig. 6.
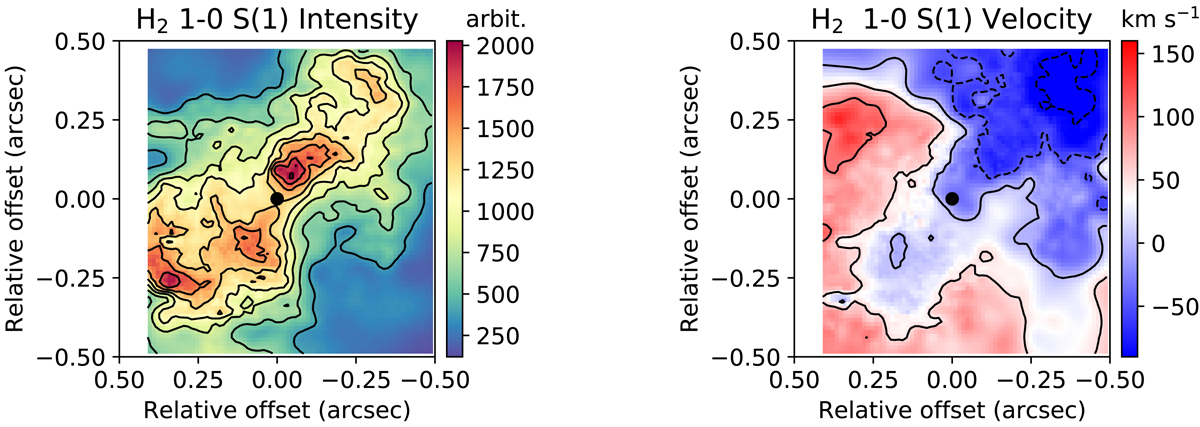
VLT/SINFONI H2 1–0 S(1) intensity (left) and velocity (right) maps from Davies et al. (2006) showing a FoV similar to that of Fig. 5. The maps were derived by fitting a Gaussian to the emission line. The black dot marks the approximate location of the peak of the near-infrared continuum. The velocities are relative to this peak. To facilitate the comparison with the CO(2–1) and CO(3-2) emission, we show the same velocity range as in the right panels of Fig. 5.
Current usage metrics show cumulative count of Article Views (full-text article views including HTML views, PDF and ePub downloads, according to the available data) and Abstracts Views on Vision4Press platform.
Data correspond to usage on the plateform after 2015. The current usage metrics is available 48-96 hours after online publication and is updated daily on week days.
Initial download of the metrics may take a while.