Fig. 5.
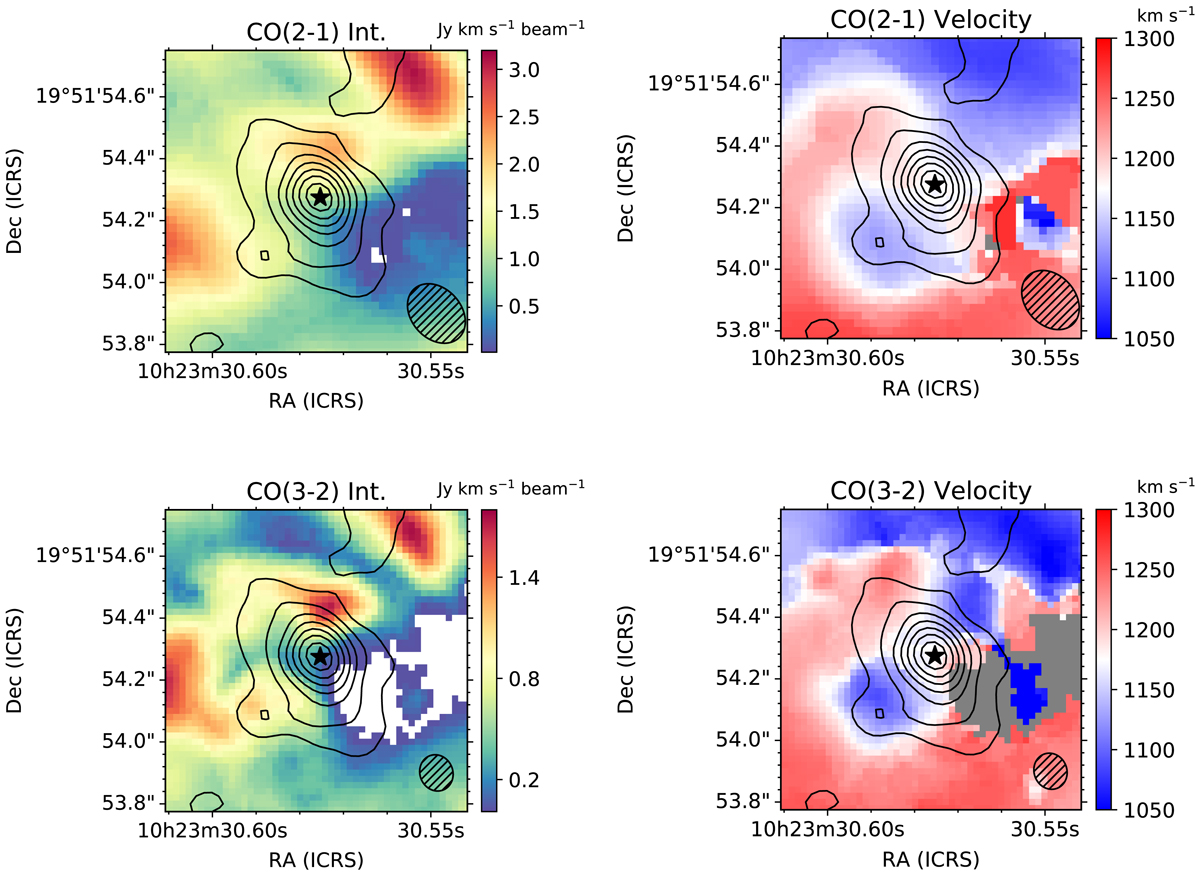
Zoom-in on the CO(2–1) and CO(3–2) emission in the nuclear 1″ × 1″ region in the top and bottom panels, respectively. These moment maps were created with the GILDAS MOMENT task using a 5σ detection threshold and show the integrated emission (zeroth-order moment map) in the left panels and the mean velocity field (first-moment map) in the right panels. The hatched ellipses show the corresponding beam size and orientation of each image (see Table 2). The contours in all panels are the ALMA continuum emission at 1.3 mm as in the left panel of Fig. 2, and the star marks the AGN position.
Current usage metrics show cumulative count of Article Views (full-text article views including HTML views, PDF and ePub downloads, according to the available data) and Abstracts Views on Vision4Press platform.
Data correspond to usage on the plateform after 2015. The current usage metrics is available 48-96 hours after online publication and is updated daily on week days.
Initial download of the metrics may take a while.