Fig. 3.
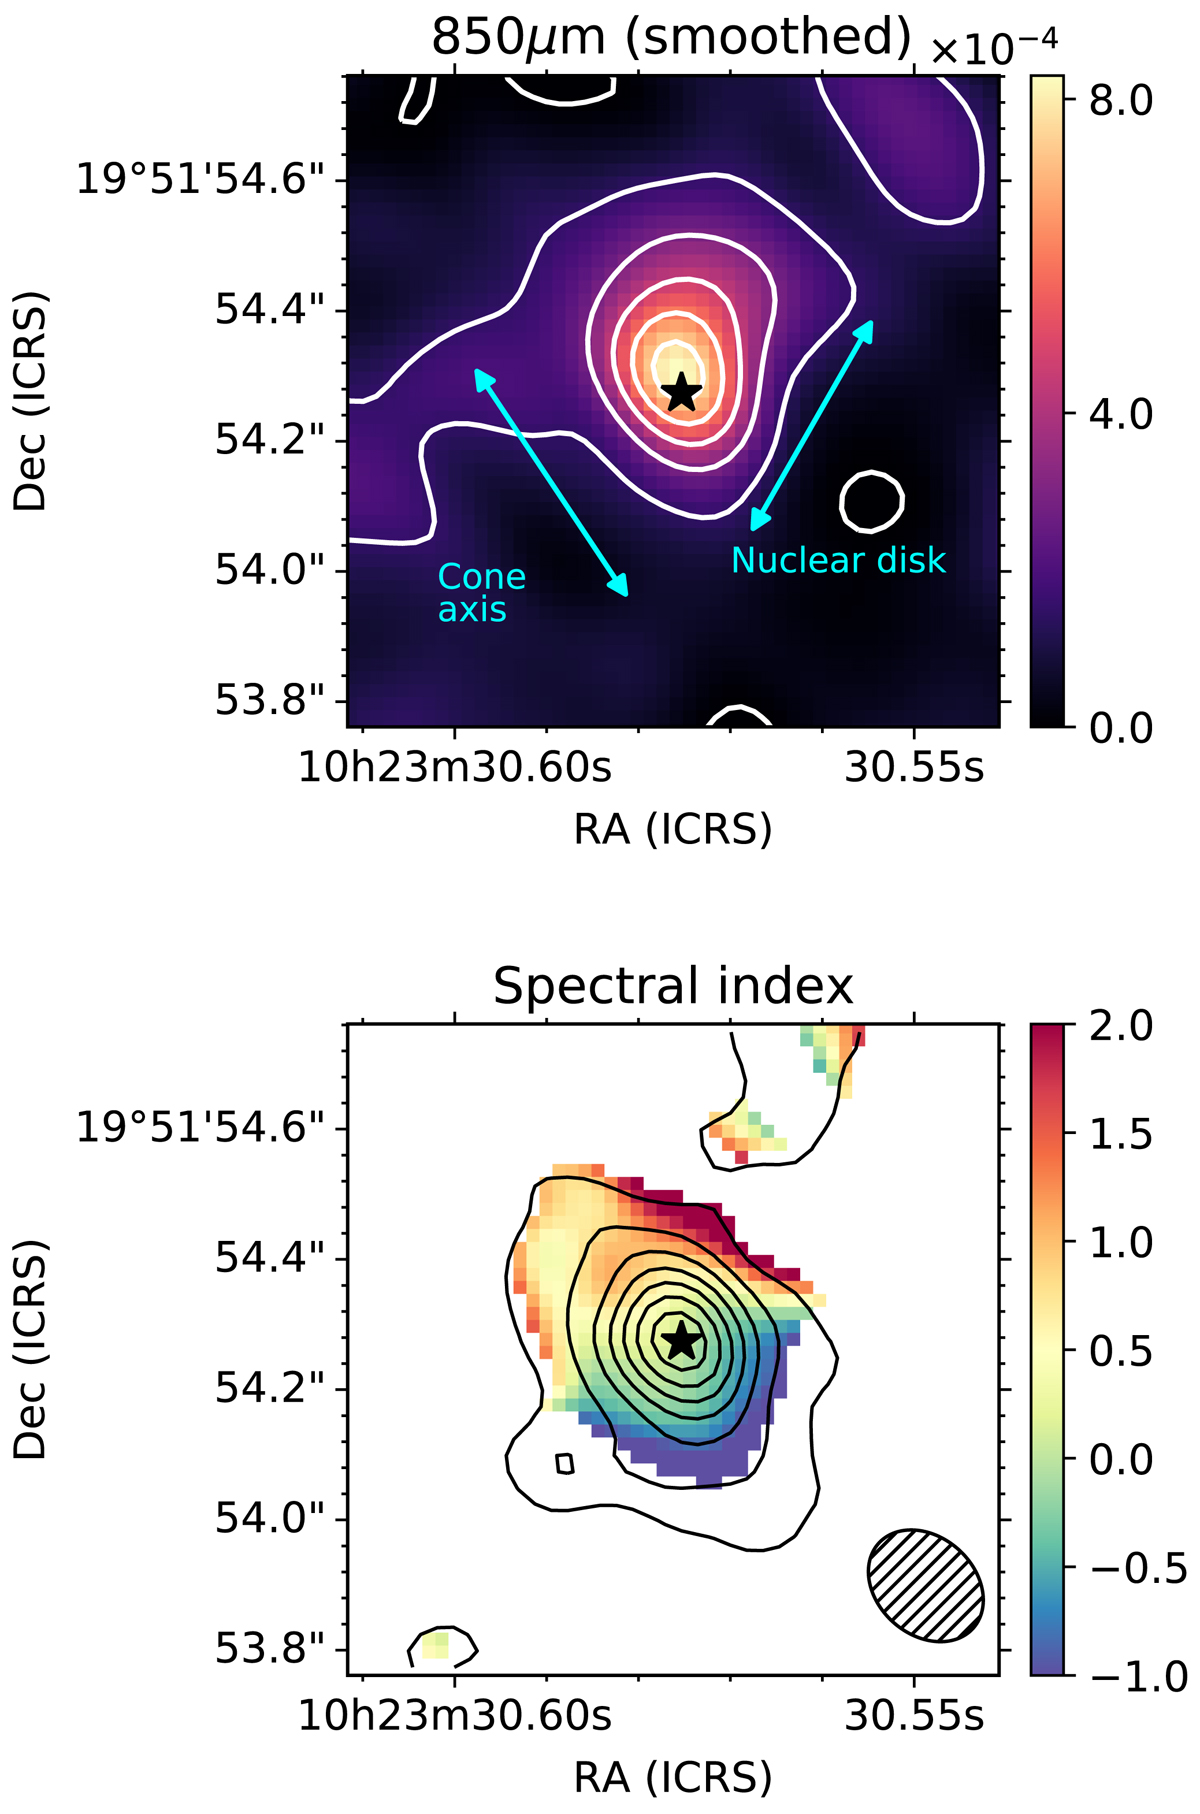
Top panel, color and white contours: map of the 850 μm continuum emission (in arbitrary units) degraded to the beam size and orientation of the 1.3 mm continuum map with b = 0.5 weight (see Table 1). This was necessary to construct the spectral index map. The map is shown for the nuclear 1″ × 1″ region. We mark the approximate orientations of the ionization cone axis and the nuclear star forming disk. Bottom panel: map of the spectral index α as derived from the ALMA continuum observations in bands 6 and 7 using only pixels detected at > 2.5σ. The FoV is the same as in the top panel. The map has the same angular resolution as the band 6 map with the b = 0.5 weight (see Table 1). The color bar indicates the values of α (see text). The contours are the band 6 continuum emission at 1.3 mm as in the left panel of Fig. 2, and the star marks the AGN position.
Current usage metrics show cumulative count of Article Views (full-text article views including HTML views, PDF and ePub downloads, according to the available data) and Abstracts Views on Vision4Press platform.
Data correspond to usage on the plateform after 2015. The current usage metrics is available 48-96 hours after online publication and is updated daily on week days.
Initial download of the metrics may take a while.