Fig. 2.
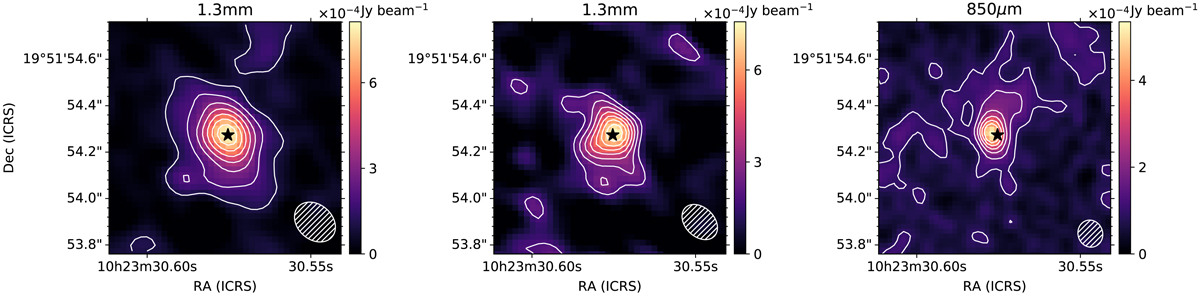
ALMA continuum images in band 6 at ∼1.3 mm from the b = 0.5 weighted data cube (left) and b = −0.5 weighted data cube (middle) and in band 7 at ∼850 μm from the natural weight data cube (right). The FoV is 1″ × 1″, which corresponds to approximately the central 73 pc × 73 pc region. In all images the first contour corresponds to the 2.5σ level and the color bars indicate the flux in units of 10−4 Jy beam−1. The hatched ellipses show the corresponding beam size and orientation in each image (see Table 1), and the star indicates the approximate location of the peak of the unresolved 1.3 mm continuum emission (see text).
Current usage metrics show cumulative count of Article Views (full-text article views including HTML views, PDF and ePub downloads, according to the available data) and Abstracts Views on Vision4Press platform.
Data correspond to usage on the plateform after 2015. The current usage metrics is available 48-96 hours after online publication and is updated daily on week days.
Initial download of the metrics may take a while.