Fig. 12.
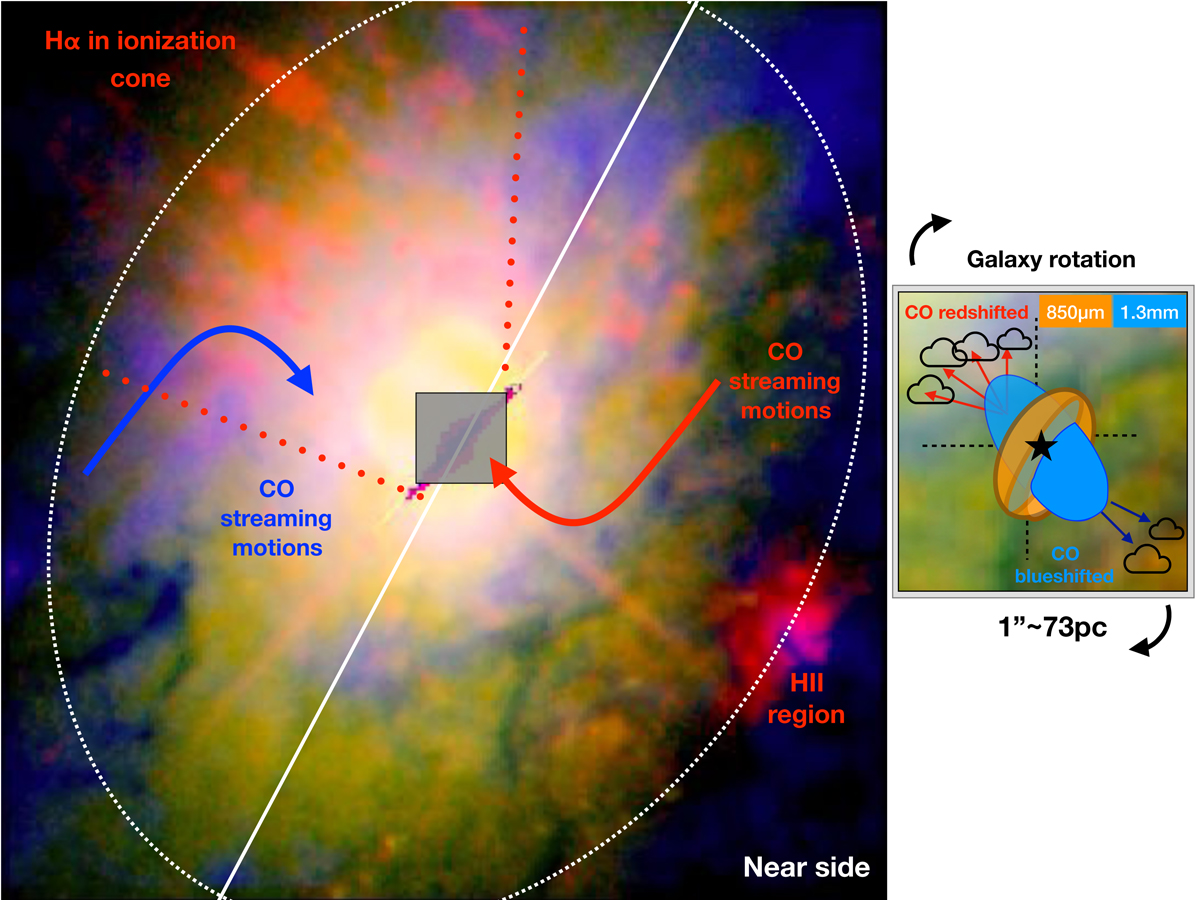
Summary of results for NGC 3227. The large RGB image to the left was produced using the ALMA CO(2–1) intensity in blue, the HST/ACS F814W image in green, and the HST/ACS F658N image in red. The FoV is approximately 10″ × 10″ as in Fig. 1. The white straight line marks the PA of the kinematic major axis of the large-scale disk, while the dashed magenta lines delineate the projected size of the ionization cone as seen in the right panel of Fig. 1. The square approximately marks the central region with a size of 1″ × 1″ that is displayed in Figs. 2 and 5. The small figure to the right is a cartoon (not to scale) representing the nuclear disk mostly traced by the 850 μm continuum and the 1.3 mm extended emission perpendicular to the nuclear disk. In both panels the arrows and their colors represent the non-circular motions observed with the CO(2–1) and CO(3–2) transitions.
Current usage metrics show cumulative count of Article Views (full-text article views including HTML views, PDF and ePub downloads, according to the available data) and Abstracts Views on Vision4Press platform.
Data correspond to usage on the plateform after 2015. The current usage metrics is available 48-96 hours after online publication and is updated daily on week days.
Initial download of the metrics may take a while.