Free Access
Fig. 11.
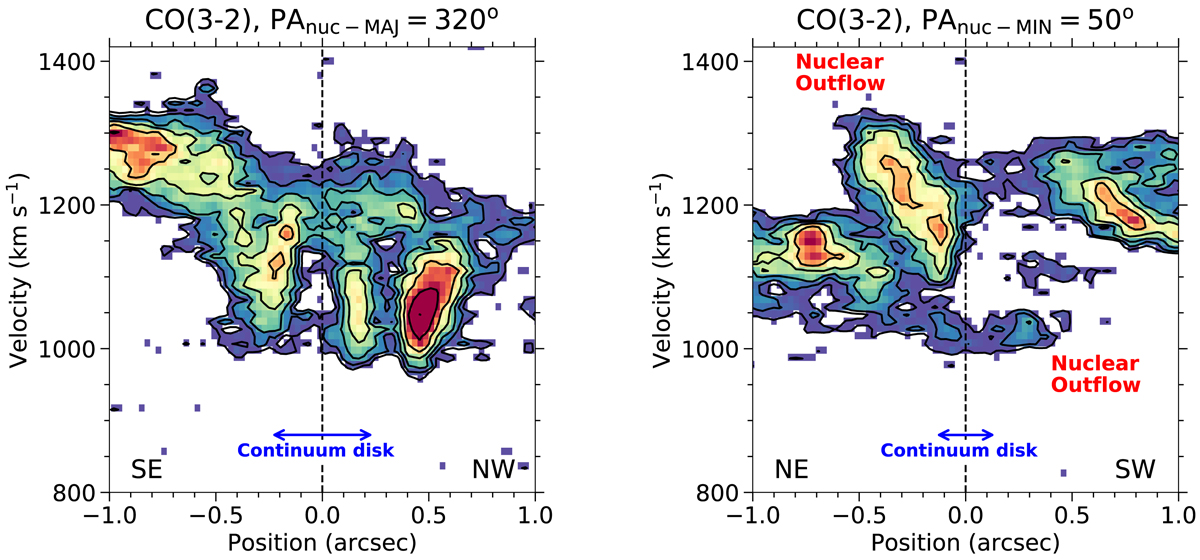
CO(3–2) p − v diagrams along the major and minor kinematic axes of the nuclear disk. We only show fluxes above 3σ. The black contours are fluxes on a linear scale. The arrows show the approximate projected size of the 850 μm nuclear continuum emission.
Current usage metrics show cumulative count of Article Views (full-text article views including HTML views, PDF and ePub downloads, according to the available data) and Abstracts Views on Vision4Press platform.
Data correspond to usage on the plateform after 2015. The current usage metrics is available 48-96 hours after online publication and is updated daily on week days.
Initial download of the metrics may take a while.