Fig. 10.
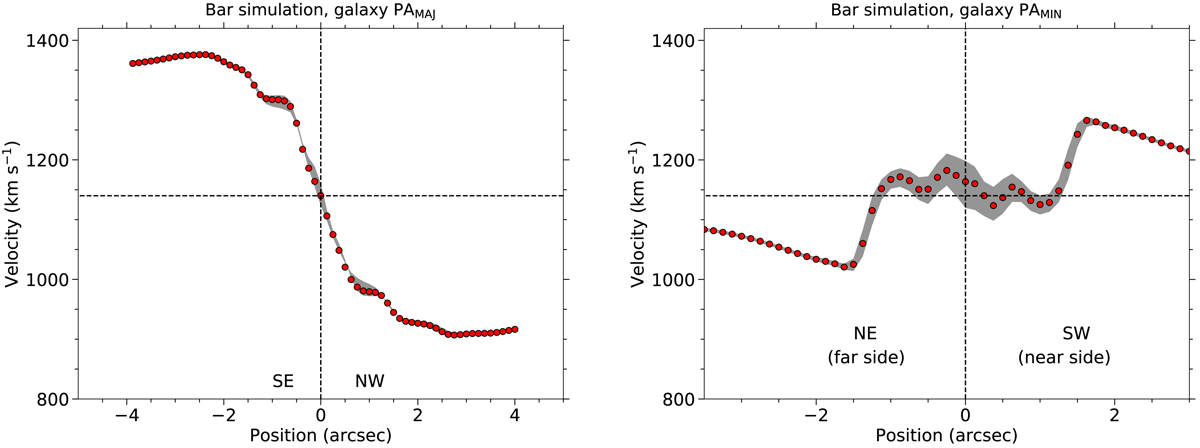
Gas line-of-sight velocity versus distance from the center along the galaxy disk kinematic major (left panel) and minor (right panel) axes. The gas line-of-sight velocity field corresponds to the 0S20r simulation of a strong bar (Maciejewski 2004), and adapted to our ALMA resolution as well as to the NGC 3227 disk geometry, and observed CO(2–1) velocities. In each panel the cut passing through the center is plotted with the dot symbols. We also extracted two additional cuts on both sides of the center at ±0.1″ which are represented with the shaded area. These plots can be directly compared with the observed CO(2–1) p − v diagrams in the top panels of Fig. 8.
Current usage metrics show cumulative count of Article Views (full-text article views including HTML views, PDF and ePub downloads, according to the available data) and Abstracts Views on Vision4Press platform.
Data correspond to usage on the plateform after 2015. The current usage metrics is available 48-96 hours after online publication and is updated daily on week days.
Initial download of the metrics may take a while.