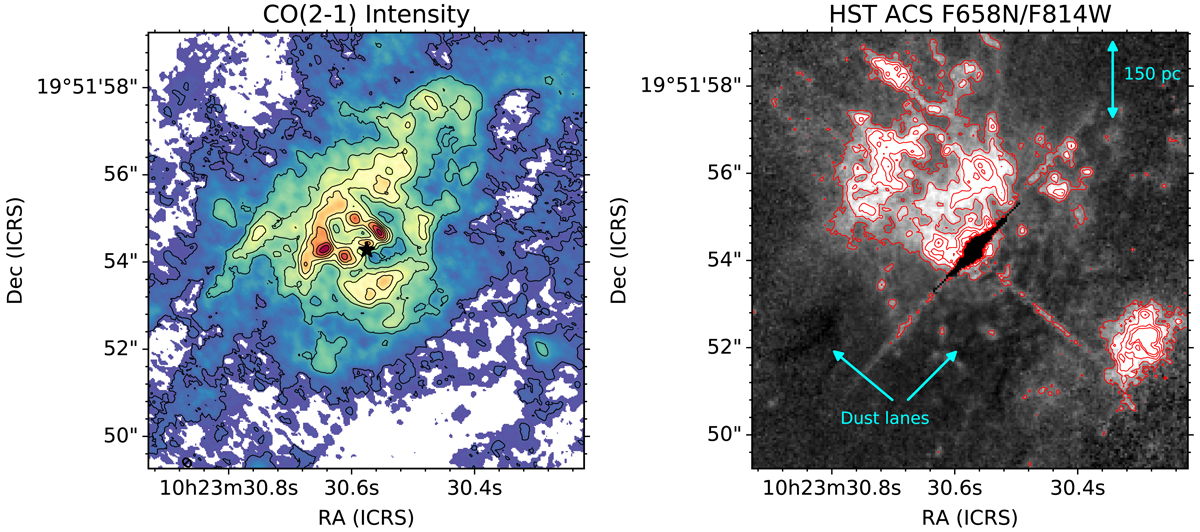
Fig. 1.

Left panel: ALMA CO(2–1) integrated molecular line map (zeroth-order moment map) created using a 3σ threshold. The image displays the central 10″ × 10″ (730 pc × 730 pc) and was created from the b = 0.5 weighted data cube. We show the image and contours with a linear scale. The CO(2–1) contours are 0.0925, 0.515, 0.9375, 1.36, 1.7825, 2.205, 2.6275, and 3.05 Jy km s−1 beam−1. The star indicates the AGN location, based on the peak of the unresolved 1.3 mm continuum emission (see text). Right panel: HST/ACS pseudo-Hα+[N II] line map (highlighted in light colors) plus extinction map (highlighted in dark colors) constructed as an F658N/F814W map (in arbitrary units) and showing the same FoV as the ALMA CO(2–1) image. The broadband F814W image is saturated at the nuclear position.
Current usage metrics show cumulative count of Article Views (full-text article views including HTML views, PDF and ePub downloads, according to the available data) and Abstracts Views on Vision4Press platform.
Data correspond to usage on the plateform after 2015. The current usage metrics is available 48-96 hours after online publication and is updated daily on week days.
Initial download of the metrics may take a while.


