Fig. 11.
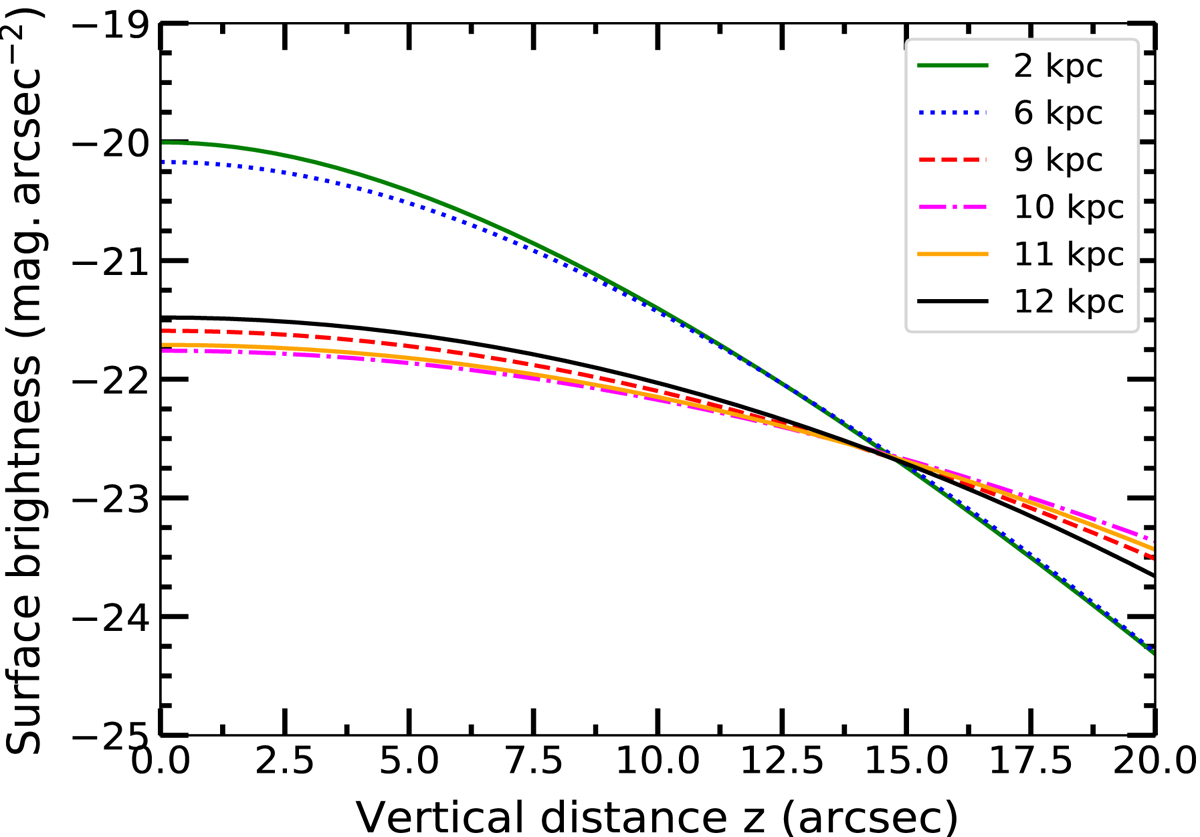
Results for the surface brightness distribution along z for R = 2, 6, 9, 10, 11, and 12 kpc when the profiles are stacked together at 15″ to form a composite z-profile. Similar to Fig. 10, here also the profiles deviate from each other. The deviation is larger at smaller z because the profiles are stacked at a higher z value. If the profiles had the same disk thickness, they would essentially be superimposed on each other and form a single curve.
Current usage metrics show cumulative count of Article Views (full-text article views including HTML views, PDF and ePub downloads, according to the available data) and Abstracts Views on Vision4Press platform.
Data correspond to usage on the plateform after 2015. The current usage metrics is available 48-96 hours after online publication and is updated daily on week days.
Initial download of the metrics may take a while.